The problem is that most users underestimate how much configuration knowledge it takes to get useful output. Dataset selection, column configuration, filter logic, and report grain all directly affect what you see — and getting any one of them wrong can mean empty results, duplicated rows, or a complete restart.
This guide covers what you need before starting, the exact creation steps, the key parameters that shape your output, common mistakes to avoid, and where native 360 Reporting hits its limits for construction finance teams.
Key Takeaways
- 360 Reports pull data from multiple Procore tools across active and inactive projects — Single Tool Reports are limited to one tool on active projects only
- You need at least Standard permission on the Company 360 Reporting tool, plus appropriate permissions on each source tool
- Building a report follows four stages: navigate and initiate, select dataset, configure columns, then apply filters and groupings
- Dataset selection is irreversible — choosing the wrong one forces a complete restart
- Report grain shifts with every non-measure field added — unexpected row duplication follows if you're not watching for it
What You Need Before Creating a Company 360 Report
Skipping preparation is the most common reason 360 Reports return confusing or empty data. Before touching the UI, confirm two things: your permissions are in order and you know which dataset contains the fields you need.
Permissions
Creating a Company 360 Report requires Standard or Admin permission on the Company-level 360 Reporting tool. Data visibility within the report is controlled separately by tool-level permissions on each source tool — Procore's 360 Reporting permissions documentation covers both layers in detail.
For most financial datasets — Commitments, Prime Contracts, Subcontractor Invoices — you generally need Admin-level access on the source tool to see that data appear in your report. If a colleague builds a report and shares it with someone who lacks Admin on Commitments, commitment columns will come back blank.
Also worth knowing: company-level date fields in 360 Reports reflect the company's configured timezone, not the project timezone.
Dataset and Data Model Readiness
Procore organizes 360 Reporting data in a three-level hierarchy: Dataset → Object → Field. You need to know which dataset maps to your goal before you start, because you cannot switch after creation.
| Reporting Goal | Dataset to Select |
|---|---|
| Budgets, contracts, change orders, invoices | Financials |
| Labor hours, timecard data, allocations | Resource Management |
| RFIs, submittals, inspections | Project Execution |
| Company/user/contact data | Directory & Portfolio |
| Platform usage and activity | User Activity |
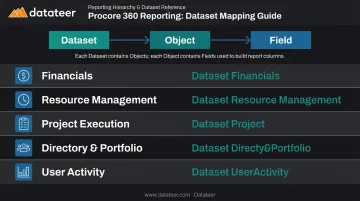
If you're unfamiliar with which objects live in each dataset, review Procore's 360 Reporting Data Guide before starting.
Understanding Measures vs. Dimensions
Before building, know the difference between these two field types:
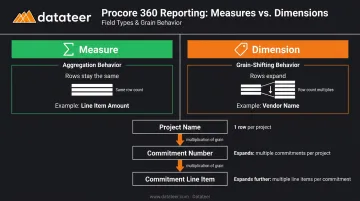
- Measures — quantitative values that can be aggregated (line item amounts, hours, costs)
- Dimensions — descriptive attributes used to label and group rows (project name, vendor, status)
Adding the wrong type of field at the wrong point can produce inflated totals or unexpectedly expand your row count. Confusing the two is one of the most common sources of inflated totals in new reports — so nail this before you start adding fields.
With permissions confirmed and your dataset identified, you're ready to build.
How to Create a Company 360 Report in Procore
The process splits into two phases: initiating the report (name + dataset selection) and configuring it (columns, filters, groupings, custom calculations). One critical note: configuration changes don't refresh data automatically unless you disable the manual load toggle — covered in Step 4.
Step 1: Navigate to 360 Reporting and Initiate the Report
- From the Company level in Procore, open the 360 Reporting tool
- Click "Create Report" in the top-right corner
- Select the "360 Report" tile — not Single Tool Report or Canned Report
The 360 Report tile is the only option that supports cross-tool, multi-project data spanning both active and inactive projects.
Step 2: Select Your Dataset
Under "Select Data Set," choose the dataset that contains the primary data object for your reporting goal. Examples:
- Financials → budgets, commitments, change orders, owner invoices
- Resource Management → timecards, labor allocation data
- Project Execution → RFIs, submittals, inspections, daily logs
Click "Continue."
⚠️ You cannot switch datasets after this step. If you select the wrong dataset and realize it mid-build, you must start over. Take a moment here to confirm the dataset before proceeding.
Step 3: Configure Columns
Click the Columns icon in the right sidebar. Use the angle bracket to expand field groups or the search box to find specific fields. Check the box next to each field to add it as a column.
This is where report grain matters. Every non-measure (descriptive) field you add changes what each row represents:
- Add "Project Name" → one row per project
- Add "Commitment Number" → one row per contract
- Add "Commitment Line Item" → one row per line item
Fields from joined objects behave differently depending on type:
| Field Type | Example | Effect on Rows |
|---|---|---|
| Measure | Line Item Amount | Aggregates to current grain — rows stay the same |
| Dimension | Vendor Name | Shifts grain — rows expand, sometimes dramatically |
Column management options once fields are added:
- Drag to reorder columns
- Resize using the column edge cursor
- Vertical ellipsis (⋮) to pin, sort, filter by, or remove a column
You can also group or filter by a field without displaying it as a column — hover over the field name in the Configure Columns panel and click the group-by or filter icon that appears.
Step 4: Apply Filters, Custom Columns, and Table Groups
Filters: Open the Filters panel and use "Add Filters" to search for any field. The three filter types per Procore's documentation:
- Text/status fields — Include or Exclude with selectable values
- Date fields — Fixed Date Range, Custom Time Period (e.g., Last 3 Months), or None/All
- Boolean fields — Yes, No, or None buttons
Custom columns: Open the Custom Columns panel to add calculated fields. Two column types are available:
- Basic Calculation: add, subtract, multiply, or divide two measure columns (useful for budget variance)
- Date Variance: calculate the difference in days between two date fields
Number format options: Number, Currency, or Percent.
Table Groups: Open the Table Groups panel, use drag-and-drop to set group priorities, then click "Update" to apply.
Finally — click "Load Data." By default, the Load Data Manually toggle is ON, meaning the report won't refresh automatically after changes. Always click "Load Data" after any structural change.
Key Parameters That Shape Your 360 Report Results
The difference between a useful 360 Report and a confusing one almost always comes down to four variables that aren't obvious from the UI.
Dataset Selection
Each dataset is a self-contained pool. You cannot combine fields from Financials and Resource Management in a single report. Choosing the wrong dataset means your target fields simply won't exist in the column picker.
Practical mapping for construction finance teams:
- WIP schedule values and cost-to-complete → Financials
- Labor hours vs. budgeted hours → Resource Management
Report Grain and Row Duplication
Procore's Data Guide defines grain as "the level of detail that determines what a row represents." When you join objects with a one-to-many relationship, adding a dimension from the "many" side multiplies rows.
For example: adding Commitment Number to a project-level report gives you one row per commitment. Add Commitment Line Item, and each row becomes a line item — potentially 50 rows where you had one before. This is expected behavior, but users who don't realize it's happening often misread aggregated totals.
Watch for indirect joins in particular. When two objects connect through a third "middleman" object, row multiplication risk is highest. If your totals look off, check whether any joined objects have indirect relationships in the Data Guide.
Filter Scope: Active vs. Inactive Projects
By default, 360 Reports pull from both active and inactive projects. For firms with large historical portfolios, this can inflate data volume considerably. If you only want current projects, add the "Projects > Is Active" field and filter it to "Yes."
Load Data Manually Toggle
| Setting | Behavior | Best For |
|---|---|---|
| ON (default) | Must click "Load Data" after each change | Large datasets, complex financial reports |
| OFF | Auto-refreshes after every change | Smaller reports, faster iteration |
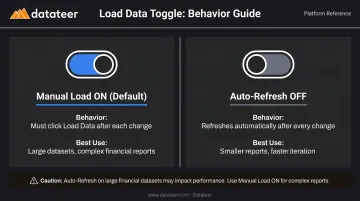
For financial reports spanning many projects, leave it ON — auto-refresh slows down noticeably once your dataset gets large.
Common Mistakes When Building 360 Reports in Procore
Choosing the Wrong Dataset First
Because the dataset is locked after selection, starting with Project Execution when you need budget variance data means starting over completely. Always map your reporting goal to a dataset before clicking "Continue." If you're unsure, check the join relationship tables in the Data Guide to confirm which objects are available.
Misunderstanding Grain and Overloading Fields
Adding too many dimension fields from indirectly joined objects is the fastest path to a report with thousands of duplicated rows and inflated totals. The distinction matters:
- Adding a measure from a joined object aggregates data — it won't add rows
- Adding a dimension from that same joined object shifts grain and will add rows
Skipping "Load Data" After Configuration Changes
Since the manual load toggle is ON by default, changing filters or columns without clicking "Load Data" produces stale or empty results. New users consistently hit this wall. Treat "Load Data" as a required step after any structural change — filters, columns, or groupings — not an optional refresh.
Ignoring Permission Gaps Before Sharing
Sharing a 360 Report does not grant the recipient permissions to the underlying source tools. If someone lacks Admin on Commitments, commitment columns will return blank or restricted data for them. Confirm tool-level permissions before distributing any report that includes financial data.
When Procore 360 Reporting Isn't Enough for Construction Finance
Procore's 360 Reporting is a capable cross-tool query builder. For operational reporting — tracking RFI counts, submission status, inspection completion rates — it does the job well.
Construction finance is a different story.
A CFO or Controller who needs a weekly WIP schedule faces a real manual burden in 360 Reporting. They have to select the right Financials objects, configure joins between budget line items and commitment line items, apply the correct filters, and manually refresh each reporting cycle. For firms managing 20+ concurrent projects, nearly 50% of construction stakeholders cite the inability to combine data from different sources as a top challenge — and the manual rebuild cycle in 360 Reporting does nothing to fix that.
The structural limitations are worth naming directly:
- No pre-built financial dashboards: every report starts from a blank configuration
- No cross-system data blending: Procore data can't be combined with Sage, Vista, or Acumatica in a single view
- Manual refresh cycle: no automated overnight sync, no live dashboard
- No native WIP calculations: percentage complete, over/under-billings, and cost-to-complete all require manual field setup
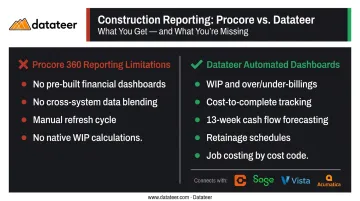
Datateer automates that entire rebuild cycle. Rather than requiring finance teams to build reports inside Procore, Datateer pulls data automatically from Procore (along with Sage, Viewpoint Vista, Acumatica, and 15+ other systems) and delivers pre-built construction finance dashboards on day one. Day-one dashboards include:
- WIP and over/under-billings
- Cost-to-complete and margin fade tracking
- 13-week cash flow forecasting
- Retainage schedules
- Job costing by cost code and phase
The WIP dashboard calculates percentage complete, earned revenue, billed revenue, costs in excess of billings, and projected margin per job — automatically. One customer, Double L Management, put it plainly: "That one click replaced two weeks worth of prior work."
Implementation takes 2-4 weeks. Flat annual pricing starts at $10,000 per data source with unlimited users — no per-seat fees, no per-dashboard charges. If you're spending meaningful time rebuilding financial reports in Procore each reporting cycle, a 15-Minute Workflow Audit with Datateer is a practical next step to see whether automation makes sense for your team.
Frequently Asked Questions
What is 360 Reporting in Procore?
Procore's 360 Reporting is a built-in cross-tool reporting feature that lets users create custom reports using data from any Procore tool across both active and inactive projects. It's available at both the company and project level, and unlike standard reports, it supports multi-tool data combinations.
How do you use 360 Reporting in Procore?
Access 360 Reporting from the Company or Project level and click "Create Report." Select the 360 Report type, choose a dataset, then configure columns, filters, and table groups. Click "Load Data" to populate results, then export to Excel or PDF when ready.
What permissions do I need to create a Company 360 Report in Procore?
You need at least Standard permission on the Company-level 360 Reporting tool. Data visibility within the report is separately controlled by tool-level permissions; financial data like commitments and invoices typically requires Admin access on the relevant source tool.
What datasets are available in Procore's Company 360 Reporting tool?
Available datasets include Financials, Resource Management, Project Execution, User Activity, Directory & Portfolio, Preconstruction, and Agent Adoption. Only one dataset can be selected per report, and it cannot be changed after the report is created.
What is the difference between a 360 Report and a Single Tool Report in Procore?
360 Reports pull data from multiple Procore tools and include both active and inactive projects. Single Tool Reports are limited to one tool on active projects only — which makes 360 Reports the right fit when you need cross-project financial or operational visibility.
Can I export a Company 360 Report from Procore?
Company 360 Reports export to Microsoft Excel, PDF, or PDF with Visuals using the enhanced export option, accessible via the Export button within the report view.