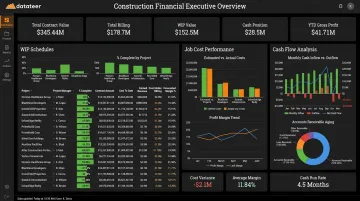
For most finance teams, that's exactly the problem. WIP reports take 10–20 days to produce manually. Job cost variances surface in the wrong meeting, too late to act on. The CFO's role becomes forensic accounting — explaining what already happened — rather than protecting margins while there's still a chance.
Construction data analytics tools change that equation. Instead of compiling data from spreadsheets, they connect directly to your ERP and deliver real-time dashboards covering WIP, job costs, cash flow, and margin health — automatically. According to an RSM survey of 250+ CFMA members, 55% of construction finance leaders call digital investment a top priority — yet only 25% have a clear digital strategy to back it up.
This guide closes that gap. We cover five tools — from purpose-built construction platforms to enterprise BI — so you can make the right call for your firm in 2026.
Key Takeaways
- Construction analytics tools eliminate the monthly WIP grind by connecting ERPs directly to pre-built dashboards
- Purpose-built platforms (Datateer, CMiC BI, Procore Analytics) deliver construction KPIs out of the box — general BI tools (Power BI, Tableau) require months of custom configuration
- Setup time ranges from 2–4 weeks for purpose-built tools to 3–6+ months for configured general BI platforms
- ERP compatibility, construction-specific KPI coverage, and pricing model are the three criteria construction finance teams should evaluate first
- Flat-fee pricing models remove the per-seat barrier that limits dashboard sharing across field and office
What Is Construction Data Analytics?
Construction data analytics connects financial and operational data from your ERP, field systems, and project management platform into a single, real-time view — covering WIP schedules, job cost tracking, subcontractor costs, billing, and cash flow.
The concept is simple. The execution isn't, because construction accounting doesn't work like most industries.
Why General BI Tools Fall Short
Construction operates on percentage-of-completion accounting, overlapping job phases, complex cost code structures, and project-level margin. As AICPA & CIMA notes, WIP schedules aren't just a reporting convenience — they're how revenue recognition works for contractors. Every WIP schedule requires:
- Calculating earned revenue vs. billed revenue per job
- Tracking costs in excess of billings (under-billings) and billings in excess of costs (over-billings)
- Projecting estimated cost to complete and future margin
A standard BI tool has no concept of any of this. Building those calculations from scratch in Power BI or Tableau is possible, but it takes months, requires data engineering resources, and produces something you'll need to maintain indefinitely.
That gap defines the two categories of tools worth evaluating.
Two Categories of Tools
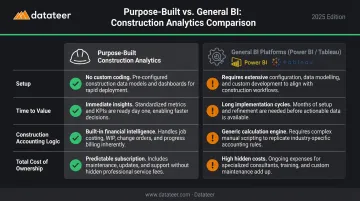
| Purpose-Built Construction Analytics | General BI Platforms (Power BI, Tableau) | |
|---|---|---|
| Setup | Pre-configured for WIP, job cost, backlog, cash flow — ready day one | Requires custom data modeling and construction logic builds |
| Time to value | Weeks | Months to years |
| Construction accounting logic | Built in | Must be built and maintained by your team |
| Total cost of ownership | Predictable flat pricing | Lower entry price; higher ongoing engineering cost |
Which category fits your firm determines every tool recommendation in this guide.
Best Construction Data Analytics Tools in 2026
Tools were selected based on ERP integration depth, construction-specific dashboard coverage, ease of setup for finance teams without dedicated data engineering staff, and demonstrated use among US construction firms.
Datateer
Datateer is an automated financial analytics platform built specifically for construction — not a generic BI tool adapted for it. The platform connects directly to 20+ construction ERPs including Procore, Sage 100/300/Intacct, Viewpoint Vista, Viewpoint Spectrum, Acumatica Construction, Foundation Software, CMiC, Jonas, QuickBooks, and NetSuite.
The core value proposition is replacing the manual WIP reporting cycle entirely. A Business Analyst at Double L Management put it directly: "The very first time we accessed our data through a Datateer analytics dashboard, that one click replaced two weeks worth of prior work."
Instead of month-old data in a spreadsheet, finance teams get dashboards updated overnight as standard — covering everything from overbilling/underbilling risk to labor slippage to 13-week cash flow forecasting.
12 dashboards are included on day one, organized into four suites:
| Suite | Dashboards Included |
|---|---|
| Executive Strategy & Solvency | Return on Assets/Equity/Revenue, Forecasted Liquidity, Cash Conversion & Velocity |
| Financial Operations & Cash Management | AR & AP Health, WIP & Over/Under-Billings, Job-Level Cash Flow |
| Project Excellence & Field Operations | Project Cost Performance, Budget vs. Actuals, PM Scorecards |
| Resource Productivity | Labor & Materials Productivity, Subcontractor Performance, Equipment Utilization |
Multi-ERP environments are handled natively — firms running Procore for project management alongside Sage for accounting get automatic reconciliation between the two systems, no manual VLOOKUP work required.
| Feature | Detail |
|---|---|
| Key Features | 12 pre-built dashboards across 4 suites; direct ERP sync with 20+ construction platforms; automated cost code standardization; 2–4 week setup |
| Pricing | Flat annual fee starting at $10,000/year per data source; unlimited users; no module add-ons — verify at datateer.com |
| Best For | Construction CFOs and Finance Managers at firms $10M–$1B+ in annual revenue who want to eliminate manual WIP reporting and move into a strategic advisory role |
Procore Analytics
Procore Analytics is the native reporting layer embedded within the Procore construction management platform. It pulls directly from Procore's data ecosystem — project schedules, RFIs, submittals, budget commitments, and change orders — giving firms using Procore as their primary PM platform a single-source reporting experience.
The platform offers 100+ pre-built reports and a drag-and-drop custom report builder. Procore Analytics 2.0 Financials integrates data from prime contracts, direct costs, change orders, and commitments, and can unify data from connected ERP systems and other tools.
Financial analytics depth is narrower than standalone platforms, and the tool's value drops sharply for firms not fully standardized on Procore.
| Feature | Detail |
|---|---|
| Key Features | 100+ pre-built reports; drag-and-drop builder; role-based dashboards; real-time Procore data |
| Pricing | Subscription-based; fixed fee tied to product mix and annual construction volume — confirm current tier availability at procore.com |
| Best For | Firms already standardized on Procore who need reporting within that ecosystem; less suited for cross-ERP or deep financial analytics |
Microsoft Power BI
Power BI is a leading general-purpose BI platform with broad construction use, particularly at firms already embedded in the Microsoft 365 ecosystem. Its connector library, Excel integration, and relatively low entry price make it a common starting point.
Where it works well:
- Firms with in-house BI or IT resources available for configuration
- Microsoft 365 shops wanting tight integration with Teams, SharePoint, and Azure
- Organizations that need custom dashboards beyond standard construction KPIs
Where the math changes: Power BI requires substantial configuration to handle percentage-of-completion accounting, WIP schedules, and construction cost code structures. A Forrester TEI study of Microsoft Power Platform found a composite organization had a 10-month implementation period before gradual rollout — and construction-specific financial logic adds complexity beyond a standard Power Platform deployment.
Per-user licensing at scale also adds up quickly.
| Feature | Detail |
|---|---|
| Key Features | 100+ data connectors; DAX modeling; AI Copilot; Teams/SharePoint collaboration |
| Pricing | Free (limited); Pro at $14/user/month; Premium Per User at $24/user/month — billed annually; verify at microsoft.com |
| Best For | Construction firms with dedicated BI/IT resources who want a customizable, Microsoft-integrated platform and can absorb the configuration investment |
CMiC Business Intelligence
CMiC BI is the analytics and reporting layer built into the CMiC enterprise construction ERP. For mid-to-large GCs and specialty contractors already running CMiC, it provides deep access to native ERP data — job cost, subcontract management, owner billing, payroll, and equipment — without external connectors or middleware.
CMiC's single-database architecture eliminates data silos by design, giving finance teams access to granular construction data directly within their existing system. That value is fully contingent on CMiC being your ERP — firms on other platforms get nothing from this tool.
| Feature | Detail |
|---|---|
| Key Features | Native ERP access across job cost, billing, payroll, and subcontracts; custom dashboards, queries, and card views; role-based access |
| Pricing | Enterprise pricing; bundled with CMiC ERP or available as add-on — request current pricing at cmic.ca |
| Best For | Mid-to-large GCs and specialty contractors on CMiC ERP who want analytics embedded in their existing system |
Tableau
Tableau (part of Salesforce) is a premium enterprise visualization platform used by larger construction firms and ENR-ranked contractors for complex, multi-source dashboards and executive financial reporting and presentation. Its visualization depth and dashboard flexibility exceed most platforms in this category.
That capability comes with matching cost and complexity. Tableau requires a dedicated analytics team or data engineer to build and maintain construction-specific data models. Per-user licensing — Creator at $75/user/month — escalates quickly at scale. Every deployment requires at least one Creator license.
For organizations with the data infrastructure in place, Tableau can blend data from multiple ERPs, project management systems, and financial platforms into a single dashboard layer. For most construction finance teams without that infrastructure, the setup investment is hard to justify.
| Feature | Detail |
|---|---|
| Key Features | 100+ connectors; advanced visual analytics; Tableau GPT AI insights; Tableau Prep for data transformation; on-premises or cloud deployment |
| Pricing | Creator at $75/user/month; Explorer at $42/user/month; Viewer at $15/user/month — billed annually; verify at tableau.com |
| Best For | Large GCs and ENR contractors with dedicated analytics staff who need premium visualization and can invest in custom construction data modeling |
How We Chose These Tools
The evaluation focused specifically on the needs of construction CFOs and finance managers — not general BI buyers. That distinction changes the outcome. The most common mistake in this category is selecting a tool based on brand recognition (Power BI, Tableau) without accounting for the configuration effort required to handle construction-specific accounting logic.
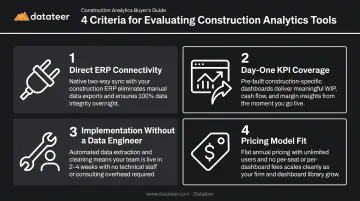
Four Criteria Used
Direct ERP connectivity — Does the tool connect natively to construction ERPs, or does it require middleware and manual maintenance? Direct integrations sync automatically. Connector-based setups need ongoing IT support and introduce data lag.
Day-one KPI coverage — Can the finance team access WIP, job cost, backlog, and cash flow dashboards without a custom build? Purpose-built platforms deliver these on day one. General BI tools require months of configuration to reach the same starting point.
Implementation without a data engineer — Can the finance team go live without dedicated technical staff? Purpose-built platforms typically take 2–4 weeks. General BI configurations routinely run 3–6+ months before producing a single useful dashboard.
Pricing model fit — Does per-user licensing create barriers to sharing dashboards across the field-office divide? Per-seat models quietly limit adoption as firms grow. Flat annual pricing removes that friction and supports company-wide visibility.
We evaluated all tools against the needs of US construction firms in the $10M–$1B+ revenue range — where delayed or inaccurate financial reporting directly affects project margins and bonding capacity. The tool reviews that follow reflect these criteria.
Conclusion
The central choice here isn't really between five tools — it's between accepting a 10–20 day delay in your financial visibility or eliminating it. Generic BI tools require months of configuration and ongoing technical maintenance to do what purpose-built construction platforms deliver on day one. Spreadsheet-based WIP reporting keeps your team in forensic accounting mode instead of protecting margins.
When evaluating options, go beyond the feature list. Ask:
- How long does setup actually take?
- Who owns maintenance month to month?
- Does it reduce the close workload, or create new work?
Datateer was built to answer those questions directly: 20+ ERP integrations, 12 pre-built dashboards live from day one, flat annual pricing with unlimited users starting at $10,000/year per data source, and a 2–4 week setup window.
If you want to see how it fits your stack, reach out at hello@datateer.com or book a free 15-Minute Workflow Audit. No slides, no pitch — just a look at your current workflow and what the dashboards would show with your actual data.
Frequently Asked Questions
What are the best construction data analytics tools with advanced dashboards in 2026?
Purpose-built platforms — Datateer, Procore Analytics, and CMiC BI — deliver construction-specific KPIs like WIP schedules, job cost variance, and margin fade out of the box. General BI tools like Power BI and Tableau offer more customization flexibility but require significant configuration before they're useful for construction finance workflows.
Is construction analytics still worth the investment in 2026?
The shift is away from static monthly reports toward automated, real-time dashboards, not away from analytics altogether. AI-assisted insights are emerging, but the ROI case for purpose-built construction analytics is stronger than ever: catching margin fade early and eliminating WIP lag matters most when construction margins stay razor-thin.
What is construction data analytics and how does it differ from general business analytics?
Construction analytics handles percentage-of-completion accounting, WIP schedules, job cost codes, and project-level margin. These are complexities standard BI tools don't address natively. You either need a purpose-built platform pre-configured for these workflows, or a general BI tool with months of custom development before it's useful.
How do construction analytics tools integrate with ERPs like Procore, Sage, or Vista?
Direct/native integrations sync automatically, handle data mapping, and require no ongoing middleware maintenance. Connector-based integrations (common with general BI tools) require middleware, manual field mapping, and IT support to keep running — adding overhead that grows as your data volume does. Datateer offers direct integrations with Procore, Sage, Vista, and 12+ other construction ERPs out of the box.
What KPIs should construction CFOs track in a financial analytics dashboard?
The core set includes: WIP schedule (overbilling/underbilling), job cost variance vs. budget, gross margin by project, backlog and revenue burn, labor productivity, cash flow/AR aging, and days sales outstanding. Datateer's platform covers all of these across its 12 day-one dashboards with 50+ pre-wired construction KPIs.
How long does it take to implement a construction analytics platform?
Purpose-built construction platforms like Datateer typically go live in 2–4 weeks with pre-built dashboards ready from day one. General BI tools configured for construction — Power BI or Tableau — typically take 3–6+ months and require ongoing technical resources to maintain the data models.