The problem isn't effort — it's architecture. According to an Autodesk/FMI study, North American construction project staff dedicate 40% of their weekly labor to data-related tasks. That's not a reporting problem. That's a workflow problem.
Automating labor productivity reports sounds simple. In practice, results vary dramatically based on data source quality, cost code consistency, and how the ERP connects to the reporting layer. Many automation attempts fail quietly — producing reports that look clean but reflect bad data.
This guide covers the five steps to automate labor productivity reporting correctly, when automation makes sense (and when it doesn't), and the variables that determine whether your reports drive decisions or collect dust.
Key Takeaways
- Automation inherits bad data — clean your ERP inputs before building anything on top of them
- Cost code standardization is the most skipped and most critical prerequisite
- Direct ERP integration beats CSV exports every time; exports break, lag, and create version conflicts
- Five steps to get there: audit data sources, define metrics, standardize cost codes, connect your ERP, and schedule automated distribution
- Successful automation turns finance managers from data compilers into margin protectors
How to Automate Labor Productivity Reports in Construction
Step 1: Audit Your Current Labor Data Sources
Before touching any software, map every place labor data currently lives:
- ERP timesheets (Sage, Vista, Acumatica, Procore, etc.)
- Foreman daily logs (paper, app, or emailed)
- Payroll exports
- Manual spreadsheets tracking crew hours
For each source, ask two questions: Is this data captured at the cost code level or only at the project level? And how much lag exists between field work and data entry?
Supervisor-estimated hours entered on Friday are structurally different from worker-verified entries posted daily. Both can live inside the same ERP and produce wildly different productivity calculations.
Check whether your ERP is already capturing the four inputs automation requires: budgeted hours per cost code, actual hours posted, crew or worker assignments, and installed quantities. If any of these are missing, automation won't create them — it will just surface the gap faster.
Step 2: Define the Metrics and Report Structure You Actually Need
Most firms build one report and send it to everyone. That's the wrong approach.
Metrics every labor productivity report should include:
- Budgeted vs. actual hours by cost code
- Productivity rate (installed units ÷ labor hours)
- Labor cost variance (absolute dollars and percentage of estimate)
- Crew-level performance by phase or activity
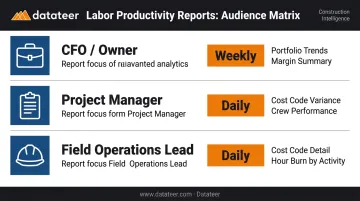
Match report depth to audience:
| Audience | Frequency | Depth Needed |
|---|---|---|
| CFO / Owner | Weekly | Portfolio trends, margin summary |
| Project Manager | Daily | Cost code variance, crew performance |
| Field Operations Lead | Daily | Cost code detail, hour burn by activity |
Before you build anything, document the exact calculation logic for each metric. Define whether "productivity rate" means installed quantity ÷ labor hours or output per crew-day. Define whether budget variance is expressed in dollars or percentage. These decisions must be made before the automation is built, not discovered after the first report looks wrong.
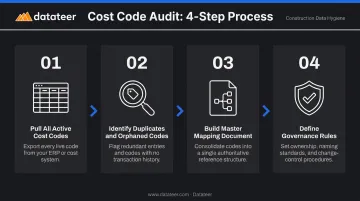
Step 3: Standardize and Map Your Cost Codes
Most firms skip this step. It's also the one that determines whether automated reports are useful or misleading.
If "framing" is coded as 03-200 on one project and FRM-STUD on another, cross-project labor comparisons are meaningless. Automated reports will surface those inconsistencies at scale — and instead of saving time, your finance team will spend it debugging.
What a cost code audit requires:
- Pull all active cost codes across every live project
- Identify duplicates, renamed codes, and orphaned codes with no entries
- Build a master mapping document that normalizes codes to a single taxonomy
- Define governance: who creates new cost codes, how they must be named, and who approves additions
Platforms like Datateer automate cost code standardization during implementation — the system maps your ERP's data logic into a unified structure and flags broken or malformed entries. But that automation works best when the underlying governance rules are already established. Software can clean historical inconsistency; it can't prevent new ones without process rules behind it.
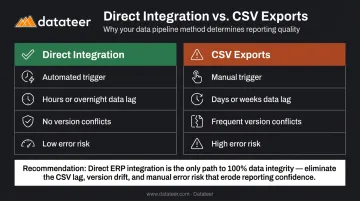
Step 4: Connect Your ERP to an Automated Reporting Layer
This is where firms face a critical decision: direct ERP integration or scheduled CSV exports.
CSV exports look simpler on the surface, but the manual transfer process introduces exactly the problems you're trying to eliminate. FMI research found that 49% of E&C firms manually transfer data between applications — and every manual transfer is a point where data can be stale, overwritten, or version-conflicted.
Direct integration vs. CSV exports:
| Factor | Direct Integration | CSV Exports |
|---|---|---|
| Trigger | Automated | Manual (or breaks) |
| Data lag | Hours or overnight | Days or weeks |
| Version conflicts | Eliminated | Frequent |
| Error risk | Low | High |
For the integration layer itself, evaluate two options:
- Custom data pipeline: Flexible but requires data engineering resources and ongoing maintenance
- Pre-built construction intelligence platform: Faster to deploy, pre-configured for construction data models
Datateer syncs directly with 12+ major construction ERPs — including Procore, Sage 100/300/Intacct, Viewpoint Vista, Viewpoint Spectrum, Acumatica Construction, Foundation Software, CMiC, Jonas Construction, QuickBooks, and NetSuite. Overnight automated sync is the standard cadence, with more frequent refreshes available on request.
The impact is measurable. A Double L Management analyst noted that "the very first time we accessed our data through a Datateer analytics dashboard, that one click replaced two weeks worth of prior work."
Step 5: Build, Validate, and Schedule Automated Report Distribution
Once the integration is live, configure the reporting layer to run on a defined schedule — not on demand.
Run the first automated output against a manually compiled report for the same period before activating distribution — this is where calculation mismatches and rollup errors surface. Verify:
- Actuals match ERP records exactly
- Cost code rollups align with expected groupings
- Variance calculations match your documented logic from Step 2
Only after validation should you activate automated distribution. Set up reports to reach stakeholders on a schedule: operational dashboards refreshed overnight for daily users, executive snapshots delivered weekly without anyone compiling or sending them manually.
Datateer's Labor & Materials Productivity dashboard is included on day one across all subscriptions — no separate module purchase required. It surfaces labor budget variances at the cost code level, showing which crews are burning hours ahead of schedule before the phase closes.
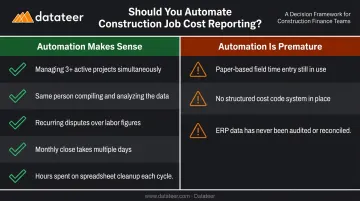
When Should You Automate Labor Productivity Reports?
Automation pays off quickly in the right environment. In the wrong one, it just accelerates existing problems.
Automation clearly makes sense when:
- You're managing three or more active projects simultaneously
- The same person compiling the report also needs to analyze and act on it
- Recurring disputes arise over which labor cost figure is "correct"
- Monthly close consistently takes more than a few days
- Finance is spending hours every month on spreadsheet cleanup before every report
Automation is premature when:
- Field time entry is still paper-based or highly inconsistent
- No structured cost code system exists across projects
- The ERP data has never been audited — automating a broken process produces broken reports faster
Dodge Construction Network found that **76% of general contractors experience data integration challenges** affecting accurate analytics and budget control. For many of those firms, the right first step is data cleanup — not dashboard deployment. Before investing in any automation tool, it's worth confirming your data foundation can support it. Datateer's free Construction Data Maturity Audit (five questions, 60 seconds) helps you determine exactly that.
What You Need Before Automating Labor Productivity Reports
The quality of automated reports is determined entirely by the quality of inputs. Two readiness areas matter most.
ERP and Data System Requirements
Your ERP must be actively capturing labor data at the cost code level before any automation layer is worth building. At minimum, confirm:
- Budgeted hours per cost code exist in the system
- Actual hours are being posted (not estimated after the fact)
- Crew or worker assignments are recorded per time entry
- Cost codes are populated on the large majority of time entries — gaps here mean gaps in every report that follows
Before building anything, verify API availability or connector support for your ERP. Datateer's Integration Blueprint provides a 60-second ERP compatibility check that maps your current tech stack and identifies the fastest path to integration.
Stakeholder and Process Readiness
Technical integration is often the straightforward part. Stakeholder misalignment is what actually derails automation projects.
Before building dashboards, get written agreement from project managers and field supervisors on:
- What "productivity rate" means and how it's calculated
- Which cost codes belong in which reporting categories
- Who owns data quality going forward
Identify one person accountable for cost code governance. Automation reduces manual labor, but it doesn't replace the judgment required to keep source data clean and authoritative.
Key Variables That Affect Automated Report Quality
ERP Data Source Quality
Autodesk/FMI estimated that bad construction data cost the global industry more than $1.84 trillion in 2020, with $88.69 billion in rework traced directly to decisions made on bad data. Dodge found 46% of general contractors frequently experience accuracy, completeness, and consistency issues with collected data.
When foremen estimate hours at week's end rather than logging them daily, those estimates flow directly into productivity calculations. The report looks precise. The underlying data isn't.
Cost Code Consistency Across Projects
Labor productivity reports become most valuable when you can compare framing productivity on Project A against Project B. That comparison only works if the same cost code taxonomy applies to both.
Inconsistent codes force manual reconciliation before every analysis — which defeats automation entirely and reintroduces the human error risk you were trying to eliminate.
Reporting Frequency and Refresh Logic
A weekly report allows trend analysis. A daily report catches intra-week slippage before it compounds. The right cadence depends on how volatile the work is and how fast decisions need to be made.
Only 28% of U.S. general contractors track performance frequently, per Dodge. For firms managing complex multi-phase work, refresh frequency is a financial decision, not a technical preference.
User Access and Report Depth
A report that doesn't match its audience won't get used — and that gap between refresh cadence and audience fit is where most automated reporting programs stall. Design distribution deliberately:
| Role | Key Report Focus |
|---|---|
| CFO / Owner | Portfolio trend lines, margin summary, forecasted overruns |
| Project Manager | Cost code variance, phase-level burn rate |
| Field Operations Lead | Crew-level hour detail, daily actuals vs. budget |
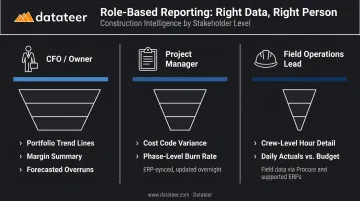
Firms that skip this step often find their automated reports go unread within 30 days — not because the data is wrong, but because the format doesn't fit how each role actually makes decisions.
Common Mistakes When Automating Labor Productivity Reports
Automating on inconsistent cost codes amplifies confusion rather than resolving it. Firms that skip standardization typically spend more time debugging outputs than they saved by automating.
CSV exports require a manual trigger, break when someone forgets, and introduce data lag that cancels out exactly the visibility automation is supposed to deliver.
A CFO needs portfolio trend lines; a foreman needs cost code variance by crew. One report designed to serve both satisfies neither and gets ignored by both.
As project scope shifts and ERP configurations change, reports drift from reality without maintenance. Schedule a quarterly review of cost code mapping, metric definitions, and distribution lists to keep outputs accurate.
Frequently Asked Questions
How do you measure labor productivity in construction?
Labor productivity is calculated by dividing output (installed units — linear feet of conduit, cubic yards of concrete, square feet of drywall) by the labor hours consumed to produce that output. That actual rate is then compared against the budgeted productivity rate from the original estimate to identify variance — a measure CFMA defines as labor hours expended per unit of completed work.
What is productivity software in construction?
Construction productivity software connects field labor data — time tracking, cost codes, and installed quantities — with financial reporting layers to generate real-time comparisons of planned vs. actual performance, ranging from field-facing time tracking apps to finance-office platforms that pull directly from ERP data.
What data sources do I need to automate labor productivity reports?
The three core inputs are: ERP-based timekeeping records (actual hours by cost code), the project estimate (budgeted hours by cost code), and optionally field production logs (installed quantities for output-based productivity rates). The ERP is the most critical source — its data quality sets the ceiling for everything downstream.
How long does it take to set up automated labor productivity reports?
With a pre-built platform that includes native ERP connectors and pre-configured construction report templates, setup typically takes 2–4 weeks. Custom-built data pipelines can take several months. The longest phase is usually cost code standardization, not the technical integration itself.
Can automated reports replace manual WIP reporting in construction?
Automated labor productivity dashboards can replace the manual WIP compilation cycle by syncing directly from the ERP on a defined refresh schedule. A finance professional still needs to review and interpret the output — automation handles the data-gathering work, not the strategic judgment behind it.