Introduction
Construction equipment is the single largest capital asset on a firm's balance sheet — and most companies have limited visibility into whether those assets are working or sitting idle, burning money either way.
The financial stakes are real. According to United Rentals, improving rental utilization to industry-average performance represented a $878,000 return to the bottom line on just $4.6M in rental spend for one contractor — a 20% upside from better visibility alone. That figure doesn't include the cost of idle owned equipment charging depreciation to jobs without delivering output.
Poor equipment utilization erodes project margins through unnecessary rentals, inflated job cost charges, and idle depreciation. By the time it surfaces in a WIP report, recovery is often too late.
This article covers how to measure utilization accurately, where hidden costs accumulate, what a structured improvement process looks like, and how finance leaders can use utilization data to make better fleet decisions.
Key Takeaways
- Utilization Rate = Actual Hours Used ÷ Available Hours — where available hours means scheduled operating time, not total calendar hours
- Heavy construction equipment averages 30–40% idle time, meaning most fleets have significant recoverable productivity
- Top cost drivers: equipment hoarding, unplanned maintenance, poor deployment decisions, and idle running
- Improvement follows a structured cycle: establish a baseline, diagnose root causes, act, then remeasure
- Finance leaders can tie utilization data directly to job costing accuracy, rent-vs.-own decisions, and margin protection
What Is Construction Equipment Utilization?
Construction equipment utilization measures how effectively a firm deploys its machinery — expressed as the percentage of scheduled operating hours during which equipment actively performs productive work, versus sitting idle, waiting on a jobsite, or parked between assignments.
The metric has two distinct dimensions, and conflating them leads to flawed decisions:
- Physical utilization — Is the machine running and performing work? This is the engine-hours-based measure most operators and equipment managers track.
- Financial utilization — Is the machine generating value relative to its cost of ownership or rental rate? A machine can clock engine hours and still be financially underperforming if it's assigned to a low-priority task while a higher-value project rents equivalent equipment at a nearby jobsite.
CFOs and finance teams need both lenses. Physical utilization feeds scheduling and deployment decisions. Financial utilization feeds job costing accuracy, fleet ROI analysis, and rent vs. own strategy.
The metric matters differently across roles:
| Role | Why Utilization Matters |
|---|---|
| Project Manager | Drives schedule efficiency and productivity per phase |
| Equipment Manager | Informs fleet sizing, redeployment, and disposal decisions |
| CFO / Finance Team | Affects job cost accuracy, margin protection, and capital allocation |
A Texas A&M University study cited by United Rentals found that 82% of participants believed increasing equipment utilization could improve ROI — but nearly half weren't tracking or measuring it. For those firms, underutilized assets quietly erode margins that never show up on a project report until it's too late to recover them.
How to Calculate Your Equipment Utilization Rate
The Formula
The standard calculation is straightforward:
Utilization Rate (%) = (Actual Hours Used ÷ Available Hours) × 100
Each variable has a specific definition:
- Actual Hours Used — Engine hours or productive operating time logged during the measurement period
- Available Hours — Scheduled operating hours (for example, 40 hours/week for a single-shift operation) — not total calendar hours in the week
A concrete example: an excavator scheduled for 40 hours/week that logs 28 engine hours has a 70% utilization rate. That 30% gap — 12 hours — translates directly into a cost figure. At an internal charge rate of $150/hour, those idle hours represent $1,800 in unrecovered cost per week, per machine.

Tracking Methods: Manual vs. Telematics
Manual tracking options include:
- Daily engine-hour logs completed by operators
- QR code scan-in/scan-out systems at jobsites
- Excel-based weekly consolidation
The limitations are significant. Manual logs produce what United Rentals describes as "not especially reliable" results — they lag by days or weeks, depend on operator discipline, and cannot distinguish between an engine that is running productively versus idling with no work being performed.
Telematics-based tracking uses GPS trackers and CAN bus connections to capture engine hours, idle time, PTO engagement, and location automatically. This produces a cleaner split between productive operating time and idle running — a distinction that manual logs structurally cannot make.
Trackunit estimates most heavy construction equipment averages 30–40% idle time, meaning much of the engine hours logged by manual systems would be classified as unproductive if telematics data were applied.
What "Good" Looks Like
Caterpillar's framework provides a practical starting point for rent vs. own decisions:
- Below 40% utilization — Renting is likely more economical than owning
- 40–65% utilization — Evaluate total cost of ownership against rental rates and other factors
- Above 65% utilization — Ownership is probably the better economic choice
These are decision thresholds, not production targets. Internal benchmarks should reflect equipment category, fleet size, and project mix. An excavator on a long-duration earthmoving contract carries different utilization dynamics than a specialty piece deployed intermittently across several project types.
The Hidden Financial Cost of Low Equipment Utilization
Low utilization rarely appears as a single line item. Its costs are distributed across several failure modes that compound each other.
Equipment Hoarding
Machines parked at completed or inactive sites "just in case" while other projects rent equivalent equipment is the most common and costly pattern. The math compounds fast.
A single boom lift held past its useful project window costs roughly $1,800/month to rent. Keep it 15 extra days and you've effectively doubled the original rental cost. Multiply that across 20–30 commonly hoarded assets and the annual impact reaches six figures — before accounting for owned assets sitting idle elsewhere in the fleet.
Unplanned Maintenance Downtime
Deferred preventive maintenance leads to unplanned breakdowns that pull equipment from productive use far longer than scheduled maintenance would. The compounding effect hits twice: repair costs typically exceed PM costs, and projects that lose access to a critical machine often trigger emergency rentals at spot rates.
Scheduling maintenance by engine-hour thresholds rather than calendar dates keeps equipment in service longer and reduces emergency breakdown frequency. That approach only works, though, if accurate hour-tracking data is in place to trigger it.
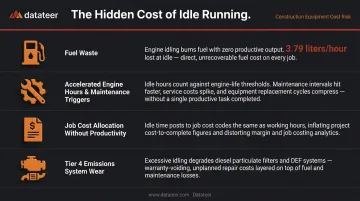
Excessive Idle Running
Engine running but no productive work being performed is particularly expensive because it's invisible without automated tracking. The financial impact runs in multiple directions:
- Fuel consumption with no output (Trackunit's example: a medium excavator burns 3.79 liters/hour at idle)
- Engine hours accumulate, accelerating maintenance triggers and warranty consumption
- Job cost allocations reflect the equipment usage without corresponding productivity
- Tier 4 emissions systems experience accelerated wear under extended idling conditions
Poor Deployment Decisions
Equipment that stays at a project after its function is complete — because no one has visibility into where it is or that it's available — creates artificial scarcity. Project managers see a gap, call for a rental, and the owned asset sits 30 miles away accumulating idle depreciation.
The Job Cost Consequence
Every one of these failure modes surfaces in the job cost report as inflated equipment line items. Owned equipment charges depreciation and ownership costs to jobs while idle. Avoidable rentals pile additional direct expense on top.
The downstream effects compound quickly:
- Gross margin compresses without a clear cause
- WIP reports overstate costs relative to work actually accomplished
- Project performance looks worse than it is — or masks a genuine problem until recovery is no longer possible
Best Practices to Improve Equipment Utilization
Establish Baselines and Custom Benchmarks
Improvement starts with a consistent measurement baseline. Define utilization thresholds for each equipment category — earthmoving, lifting, compaction, specialty — rather than applying a single firm-wide standard. An excavator deployed on continuous grading work and a concrete pump used intermittently across multiple sites require different baseline expectations.
Custom benchmarks let managers flag underperforming assets quickly and separate structural underperformance from temporary project phase transitions.
Diagnose Before Acting
Before reallocating or disposing of an underutilized asset, conduct a brief root cause review:
- Structural mismatch — Is the equipment type wrong for the current work mix?
- Temporary phase gap — Is utilization low because the project phase requiring this asset hasn't started yet?
- Operational failure — Is this hoarding, idle running, or a deployment communication breakdown?
Misdiagnosis leads to costly fleet decisions. Disposing of an asset that's temporarily underused due to project phasing creates a gap that gets filled with rentals, at higher cost than simply waiting.
Optimize Scheduling and Deployment
The most impactful operational fix is straightforward: deploy owned but underutilized assets to active projects before authorizing rentals. That requires near-real-time visibility into where equipment is and what it's actually doing.
End-of-month utilization reports help with trend analysis, but they arrive too late to prevent rentals approved three weeks earlier. According to United Rentals, customers implementing centralized equipment management can reduce annual rental expenses by as much as one-third — and reducing overall consumption delivers up to six times more savings than negotiating lower rental rates.
Implement Preventive Maintenance Tied to Usage
Scheduling PM by engine-hour thresholds rather than calendar dates alone reduces unplanned downtime by catching wear-based maintenance needs before they become failures.
The requirement: accurate hour-tracking data. Measurement infrastructure and maintenance scheduling work as a pair — one without the other leaves gaps in both visibility and reliability.
Establish a Regular Review Cadence
Different stakeholders need different review frequencies:
| Cadence | Audience | Purpose |
|---|---|---|
| Weekly | Field managers, equipment managers | Deployment decisions, reallocation, idle flagging |
| Monthly | Operations leadership | Trend analysis, job cost review, rental audit |
| Quarterly | CFO, executive team | Rent vs. own strategy, fleet composition, capital planning |
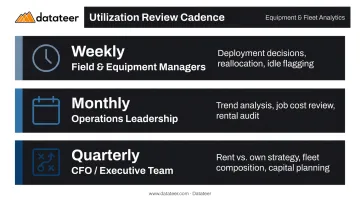
Weekly reviews catch operational problems. Monthly reviews connect utilization trends to job cost outcomes. Quarterly reviews answer the strategic question: which asset categories should the firm own, and which should it rent on demand?
From Utilization Tracking to Strategic Financial Decisions
Utilization data becomes most valuable when it flows directly into financial reporting — job costing, WIP analysis, and fleet ROI — rather than sitting in a separate equipment management silo. Firms relying on manual tracking or disconnected telematics data often face a 2–4 week lag before utilization trends appear in financial reports. CFMA notes that ERP and accounting reports often lag because they depend on weekly, biweekly, or monthly payroll and field reporting cycles. By the time the data surfaces, the rental has already been authorized, the idle depreciation has already been charged, and margin recovery requires fixing decisions that are weeks old.
Rent vs. Own as a Data-Driven Decision
Utilization history by asset class is the foundation for fleet composition strategy. Firms with access to historical utilization data can identify which equipment categories are chronically underused and better suited to on-demand rental — and which categories hit consistent utilization thresholds that justify ownership.
Caterpillar's framework (below 40% → rent; above 65% → buy) provides a starting structure, but it requires actual utilization data by asset type to apply. Without that data, firms default to gut instinct and anecdote. Closing that data gap is where the connection to financial reporting becomes critical.
Connecting Utilization to Job Costing and WIP
When equipment cost data sits in an ERP but utilization context lives in a separate telematics platform or spreadsheet, finance teams spend significant time reconciling the two before they can draw conclusions. This is the gap that automated analytics addresses.
Datateer's construction analytics platform connects directly to major ERPs to pull equipment cost and utilization data into the same dashboards as job cost and WIP reporting. Key capabilities include:
- Integrates with Procore, Sage, Viewpoint Vista, Acumatica, Foundation, CMiC, and 12+ other ERPs
- Supports CSV uploads for telematics or manual data alongside automated ERP feeds — no full telematics integration required
- Equipment Utilization dashboard ships as part of the Resource Productivity suite, available on day one
- Flat annual subscription covers all dashboards and unlimited users — no per-seat or per-dashboard fees
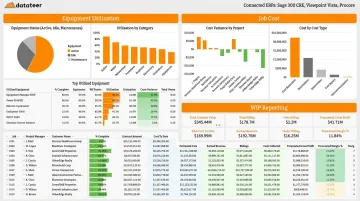
The practical result: CFOs and finance managers see equipment utilization trends alongside job-level cost performance and WIP status in one place, with data refreshed overnight rather than assembled manually at month-end. Catching margin fade a few days into a problem is a different situation than discovering it three weeks later after close.
Frequently Asked Questions
What is a good equipment utilization rate for construction?
Benchmarks vary by equipment type and project workload. Caterpillar's framework suggests owning becomes economically justified above roughly 65% utilization, while below 40% favors renting. Rather than applying a single industry figure, firms should set internal benchmarks by asset category and project type to identify underperformers relative to their own work mix.
How do you calculate equipment utilization rate?
The formula is: Actual Hours Used ÷ Available Hours × 100. Available hours means scheduled operating hours — for a single-shift operation, that's typically 40 hours/week — not total calendar hours. A machine scheduled for 40 hours that logs 28 engine hours has a 70% utilization rate.
What causes low equipment utilization on construction jobsites?
The main causes are equipment hoarding at completed sites, unplanned maintenance downtime from deferred preventive care, poor deployment decisions driven by limited fleet visibility, and excessive idle running (engine on, no productive work). Each has a direct and measurable cost impact on job margins.
How does equipment utilization affect job costing?
Underutilized owned equipment still charges depreciation and ownership costs while idle, inflating cost line items without corresponding productivity. Avoidable rentals triggered by hoarding compound this further, compressing gross margin and distorting WIP reports until the damage surfaces — by then, recovery is rarely possible.
What is the difference between physical utilization and financial utilization?
Physical utilization measures whether the machine is running and performing work; financial utilization measures whether it's generating value relative to its ownership or rental cost. Finance teams need both: the first drives deployment decisions, the second informs fleet ROI analysis and rent vs. own strategy.
How often should construction companies review equipment utilization data?
A tiered cadence works best: weekly for field and equipment managers making deployment decisions, monthly for operations leadership reviewing job cost trends, and quarterly for CFOs assessing fleet composition and rent vs. own strategy. Weekly reviews catch problems that monthly reviews consistently discover too late to fix.