Introduction
Construction finance managers know this problem well: a monthly variance report lands on a Wednesday, revealing a cost overrun that started six weeks ago. The job is past the point of correction. The margin damage is done.
That gap between when problems start and when reports surface them is where construction profitability quietly disappears. According to McKinsey's construction productivity research, 98% of megaprojects suffer cost overruns exceeding 30% of original value. With average operating margins sitting at just 4% across the industry, small variances have outsized consequences.
Choosing the right variance analysis tool is one of the most direct levers a finance team has on that problem. This guide compares five tools construction CFOs and finance managers are actively evaluating — Datateer, Procore Financial Management, Sage Intacct for Construction, Excel + Power BI, and CMiC Analytics — with a focus on practical strengths and real limitations for each.
Key Takeaways
- Construction variance analysis software compares budgeted vs. actual costs, labor, and WIP to catch margin fade before it's irreversible
- Most firms still rely on spreadsheet-based reporting that creates 10–20 day reporting lag, leaving finance teams reacting to problems instead of preventing them
- Purpose-built platforms like Datateer connect directly to construction ERPs and automate overnight data sync, with dashboards loading in minutes
- Firm size, ERP stack, and reporting priorities — project visibility, portfolio rollups, or automated alerts — determine which tool fits
- Five tools compared: Datateer, Procore Financial Management, Sage Intacct for Construction, Excel + Power BI, and CMiC Analytics
What Is Construction Variance Analysis — and Why Does Software Matter?
Construction variance analysis is the process of comparing budgeted vs. actual performance across cost codes, labor hours, materials, and WIP.
In construction, that comparison is layered. Job-cost accounting structures, percentage-of-completion revenue recognition under ASC 606, and multi-project cost code hierarchies mean you're reconciling a web of estimates, change orders, progress measures, and billing positions that shift constantly.
The Status Quo Problem
Most construction finance teams still build variance reports manually: export cost data from the ERP, reformat it by job and cost code in Excel, then distribute spreadsheets that are already stale by the time anyone reads them.
That lag turns financial oversight into forensic accounting — you're identifying what went wrong after the fact, not catching problems while projects can still be corrected.
The stakes are real. CFMA's 2024 benchmarker shows Best in Class contractors achieving 21.8% gross profit margins, while the average falls well short. With operating margins averaging just 4% for self-performing contractors, one job running 5% over budget can wipe out the profit from several others.
Why Construction-Specific Software Matters
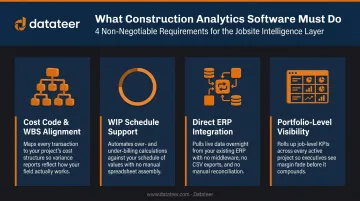
Construction variance analysis software is not general FP&A software. The best tools are built around construction-specific data structures:
- Cost code and WBS alignment — variance must map to how the ERP organizes job costs
- WIP schedule support — over- and under-billing positions require percentage-of-completion logic
- Direct ERP integration — tools requiring manual CSV exports inherit the same data freshness problem as spreadsheets
- Portfolio-level visibility — a single-project view misses the cross-job risk exposure that erodes portfolio margins
Best Construction Variance Analysis Software
These five tools represent the realistic landscape of what construction CFOs and finance managers evaluate today. Selection criteria: ERP integration depth, construction-specific variance capabilities, reporting speed, and usability for finance teams without heavy IT support.
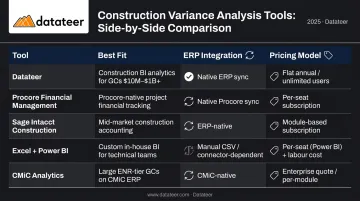
| Tool | Best Fit | ERP Integration | Pricing Model |
|---|---|---|---|
| Datateer | Construction firms wanting automated, portfolio-level dashboards on day one | Direct sync with 12+ construction ERPs | Flat annual from $10,000/year per data source; unlimited users |
| Procore Financial Management | Teams already using Procore for field ops | Native connectors for Sage 300 CRE, Vista, QBO, Xero | Per-user subscription; contact for rates |
| Sage Intacct Construction | Mid-market firms wanting full ERP + built-in reporting | Native ERP; connects with Procore, Salesforce, Datateer | Module-based subscription; contact for rates |
| Excel + Power BI | Teams with high flexibility needs and analyst bandwidth | Manual CSV exports; some Power BI direct connectors | Excel in M365; Power BI Pro at $14/user/month + labor |
| CMiC Analytics | Enterprise GCs already on CMiC ERP | Native to CMiC only; not compatible with external ERPs | Enterprise; bundled with CMiC ERP |
Datateer
Background: Datateer is a purpose-built financial analytics platform for construction firms ($10M–$1B+ in accounts receivable) that automates the financial data flow from construction ERP to executive dashboards. It integrates directly with 12+ named construction ERPs (including Procore, Sage 100/300/Intacct, Viewpoint Vista, Acumatica Construction, Foundation Software, CMiC, Jonas Construction, and QuickBooks ) with custom integrations available for systems outside the standard list.
Differentiators: Datateer is the only platform in this comparison designed exclusively for construction finance intelligence. It delivers 12 pre-built construction dashboards across four strategic suites on day one with no build time, no custom setup required from the client. Data syncs automatically overnight as standard (with more frequent refresh available), and dashboards load in minutes rather than requiring manual report generation. Flat annual pricing starts at $10,000/year per data source with unlimited users, which eliminates the per-seat cost model that penalizes growing teams. Setup runs 2–4 weeks, with annual fees starting only after data is flowing.
| Category | Details |
|---|---|
| Key Features | Automated WIP schedules, labor slippage dashboards, budget variance tracking, margin fade alerts, portfolio-level visibility across all jobs |
| ERP Integration | Direct sync with 12+ ERPs including Procore, Sage 100/300/Intacct, Vista, Acumatica; custom integrations available |
| Pricing Model | Flat annual pricing from $10,000/year per data source; unlimited users; 2–4 week setup; 12 dashboards on day one |
Procore Financial Management
Background: Procore is the most widely adopted construction management platform in the US, and its Financial Management module extends project management into cost tracking, budget management, and change order workflows. Many firms already using Procore for field operations evaluate the financial module as a natural extension.
Differentiators: Procore's strength is tight integration between field activity and financial data. Cost codes, change orders, and commitments flow from project teams into budget reports without duplicate entry. The limitation is that variance analysis is primarily project-centric. Consolidated WIP or margin fade reporting across a full job portfolio typically requires manual exports or a third-party BI tool layered on top.
Official connectors are available for Sage 300 CRE, Vista, QuickBooks Online, and Xero, though Procore notes custom WBS segments are not supported with its ERP integration tool.
| Category | Details |
|---|---|
| Key Features | Budget-to-actual tracking by cost code, change order management, commitment tracking, configurable financial reports |
| ERP Integration | Native connectors for Sage 300 CRE, Viewpoint Vista, QuickBooks Online, Xero; some require additional configuration |
| Pricing Model | Per-user subscription; pricing not publicly listed — contact Procore for current rates |
Sage Intacct for Construction
Background: Sage Intacct is a cloud-based ERP with a dedicated construction module covering job cost accounting, project financials, and financial reporting. It's a common choice for mid-market construction firms that want a full accounting system with built-in reporting rather than a separate analytics layer.
Differentiators: Sage Intacct's strength is native job cost accounting with dimensional reporting : variance can be broken down by project, cost type, labor, equipment, or division. The platform tracks actual and committed costs and provides historical WIP data by job. The trade-off: custom variance dashboards across WIP schedules and portfolio-level margin analysis require significant configuration or a connected BI tool. Datateer integrates directly with Sage Intacct as a standard offering, which extends it into automated dashboard reporting without manual exports.
| Category | Details |
|---|---|
| Key Features | Job cost accounting, budget-to-actual reports, contract revenue management, dimensional financial reporting |
| ERP Integration | Native ERP; integrates with Procore, Salesforce, and payroll systems; Datateer connects directly to Sage Intacct for dashboard automation |
| Pricing Model | Module-based subscription; pricing varies by module and user count — contact Sage for current rates |
Excel + Power BI (Spreadsheet-Based Approach)
Background: Most construction finance teams still build variance reports by pulling cost data from their ERP into Excel, reformatting by job and cost code, and distributing spreadsheets or basic Power BI dashboards. This is the incumbent workflow most firms in this comparison are actively looking to replace.
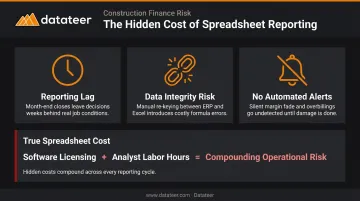
Differentiators: Excel and Power BI offer maximum flexibility and minimal incremental licensing cost, which explains why they persist. The failure points are well-documented:
- Manual data pulls create significant reporting lags
- Broken formulas and version conflicts undermine data integrity
- No automated alerting when a job crosses a margin threshold
Power BI improves visualization but doesn't solve data freshness when fed from manual exports. Microsoft lists Power BI Pro at $14/user/month (verify on Microsoft's current pricing page), but the true cost includes substantial analyst labor hours that rarely show up in the licensing comparison.
| Category | Details |
|---|---|
| Key Features | Fully flexible reporting; pivot tables, custom models, Power BI dashboards; no construction-specific logic built in |
| ERP Integration | Manual CSV/Excel exports from ERP; Power BI has some direct connectors but typically requires IT resources to maintain |
| Pricing Model | Excel included in Microsoft 365; Power BI Pro at $14/user/month (paid yearly) — but true cost includes significant analyst labor |
CMiC Analytics
Background: CMiC is an enterprise construction ERP used by larger general contractors and specialty contractors, with a built-in analytics module that pulls financial and operational data from the core ERP. CMiC reports that one-quarter of ENR Top 400 contractors rely on its platform, making it a significant player at the enterprise end of the market.
Differentiators: CMiC Analytics benefits from deep native integration with CMiC's ERP : job cost variance, subcontractor commitments, and labor productivity data are accessible without data export. The limitation is platform dependency: CMiC Analytics operates within the CMiC Enterprise Console, meaning it's only available to CMiC ERP customers. Custom dashboard development requires professional services engagement. For CMiC customers who want automated portfolio dashboards beyond native reporting, Datateer also connects directly to CMiC as a standard integration.
| Category | Details |
|---|---|
| Key Features | Job cost variance reporting, subcontract commitment tracking, configurable dashboards within the CMiC platform |
| ERP Integration | Native to CMiC ERP; accessed via CMiC Enterprise Console — not compatible with external ERP systems |
| Pricing Model | Enterprise pricing; bundled with CMiC ERP — contact CMiC for current rates |
How We Chose the Best Construction Variance Analysis Software
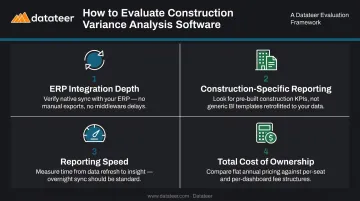
The comparison prioritized tools that finance teams can realistically deploy without heavy IT support. The evaluation framework centers on four criteria:
- ERP integration depth — Does the tool sync directly to the ERP, or require manual exports? Direct sync is non-negotiable for accurate, timely data.
- Construction-specific reporting — Does it natively support WIP schedules, cost-to-complete, and margin-by-job views? General FP&A platforms that don't support percentage-of-completion accounting are a common and costly mistake.
- Reporting speed — How quickly does data reflect field and accounting activity? Monthly cycle reporting turns finance into retrospective analysis.
- Total cost of ownership — License fees are only part of the picture. Implementation time, ongoing analyst labor, and IT maintenance hours often dwarf the subscription cost, particularly for spreadsheet-based approaches.
Matching Tool to Firm Profile
Firm size and ERP stack materially affect the right choice. A $30M specialty contractor on Sage 300 has different reporting needs than a $500M general contractor on CMiC. The right platform connects cleanly to the ERP already in use, not the other way around.
Many teams assess general BI tools without verifying whether they support construction-specific data structures. Before shortlisting any platform, confirm it handles:
- Job cost hierarchies — multi-level cost code structures tied to project phases
- Cost-to-complete calculations — not just actuals, but forward-looking projections
- Over/under-billing logic — compliant with ASC 606 percentage-of-completion accounting
A tool that looks powerful in a demo may still require months of custom development before it can produce a usable WIP schedule.
Conclusion
The cost of slow variance analysis in construction is measured in margin. By the time a monthly report surfaces a cost overrun, the job is often past the point of correction — the labor is billed, the materials are installed, and the float is gone. The firms that protect margins consistently are the ones catching variance signals while there's still room to act.
Start with an honest audit of your current process: how long does it take to produce a WIP report today, and how much of that time is manual formatting versus actual analysis? If the answer involves multiple spreadsheets, ERP exports, and a two-week production cycle, every one of those cycles is a window where margin fade goes undetected.
That gap — between when a variance starts and when a report finally surfaces it — is exactly what Datateer is built to close. The platform connects directly to your ERP and delivers automated variance dashboards in 2–4 weeks, with data flowing before annual fees begin. Book a free 15-minute workflow audit to see how the platform works with your data — or reach out directly at hello@datateer.com.
Frequently Asked Questions
What is variance analysis in construction?
Construction variance analysis compares budgeted vs. actual performance across job costs, labor hours, materials, and WIP to identify overruns, margin fade, and labor slippage. It's most actionable when the underlying data is current — monthly spreadsheet reports surface problems too late for meaningful correction.
What are the three types of variance analysis?
The three primary types are cost variance (actual vs. budgeted costs), schedule variance (actual vs. planned progress, often tied to earned value), and labor/efficiency variance (actual hours vs. estimated). Construction firms typically track all three at the job and cost-code level.
What is the best variance analysis approach for construction firms?
The most effective approach combines job-cost-level data pulled directly from the construction ERP with automated dashboards that flag variances continuously, not compiled monthly from spreadsheets. Finance teams need to catch overruns while corrective action is still possible.
How often should construction companies run variance analysis?
Best practice is continuous or at minimum weekly monitoring. Monthly Excel-based reports reflect how long manual compilation takes, not how often analysis should happen — automated ERP-connected tools eliminate that lag entirely.
What is the difference between WIP variance and budget variance in construction?
Budget variance compares total estimated vs. actual costs on a job. WIP variance refers to discrepancies in the Work-In-Progress schedule — over- and under-billing positions that affect both cash flow and reported revenue under percentage-of-completion accounting.
Can construction variance analysis software integrate with existing ERPs?
Purpose-built platforms like Datateer connect directly to 12+ construction ERPs (including Procore, Sage, Vista, and Acumatica) via automated data sync, while general BI tools typically require manual exports. Before selecting any tool, confirm whether its ERP connection is a live automated sync or a manual CSV export — that distinction determines whether your variance data is current or already stale.