Introduction
Most construction firms don't run out of work. They run out of cash — often while their backlog looks healthy and their projects are on schedule.
Construction cash flow forecasting is the process of projecting when money will flow in and out across every active and upcoming project, covering billings, retainage, subcontractor draws, and vendor accounts payable, rolled up across pursuits, backlog, and work-in-progress.
For construction CFOs, controllers, finance managers, and CPAs serving construction clients, this is mission-critical work. According to Rabbet's 2025 Construction Payments Report, slow and inconsistent payments cost the U.S. construction industry $299 billion annually — a hidden 14% tax on total project costs.
Firms operating without a forward-looking forecast aren't managing their finances. They're reacting to crises after the damage is done.
This guide covers what cash flow forecasting is, how it differs from related financial tools, how it works step by step, what drives forecast accuracy, and where most teams go wrong.
Key Takeaways
- Billings drive cash: a unified forecasting model outperforms two disconnected reports
- Retainage (typically 5–10% of every draw) is earned but not yet collected — track it as a separate line or you'll overstate liquidity
- WIP schedules look backward; cash flow forecasting looks forward — they answer different questions and replace neither
- 94% of operational spreadsheets contain errors — linking WIP, billings, and pursuit data across tabs multiplies that risk
- Start forecasting at pursuit entry, not contract signing — waiting until a job hits backlog forfeits half the visibility window
What Is Construction Cash Flow Forecasting?
Construction cash flow forecasting combines timing-based revenue projection with expenditure scheduling across the full project lifecycle. Unlike a bank balance check or budget summary, it's a model of when money actually moves.
How It Differs From Cost Forecasting
These two tools answer different questions:
- Cost forecasting: What will the work ultimately cost?
- Cash flow forecasting: When will the money actually move?
Both are necessary. Confusing them creates funded-but-illiquid projects — situations where the budget is intact but payroll is at risk because major expenditures arrived weeks before expected inflows.
How It Differs From a WIP Schedule
The WIP schedule is a backward-looking earned revenue report built for sureties and bonding agents. It tells you what happened last period. Cash flow forecasting is a forward-looking view of inflows and outflows over a defined rolling horizon — commonly 13 weeks.
| Question It Answers | Time Orientation | |
|---|---|---|
| WIP Schedule | How much did we earn and bill through month-end? | Backward-looking |
| Cash Flow Forecast | What cash do we need, and when, over the next 13 weeks? | Forward-looking |
Treating one as a substitute for the other is a structural error — the kind that surfaces during a draw request gap or a subcontractor payment run when there's no cash to cover it.
Why Construction Cash Flow Forecasting Matters
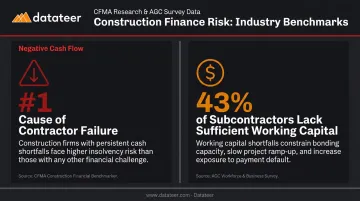
Construction projects structurally start with negative cash flow. Money goes out before any comes in — mobilization, materials procurement, early subcontractor draws. Without a model for when inflows arrive, firms risk missing payroll, delaying subcontractor payments, and triggering project shutdowns.
The CFMA identifies negative cash flow pressure as the number one cause of contractor failure. A 2025 Construction Dive report found that 43% of subcontractors lacked sufficient working capital to cover unexpected expenses or project delays.
The Cost of Getting It Wrong in Both Directions
Forecast errors create real damage regardless of which direction they go:
- Underestimation: Avoidable payment delays, strained subcontractor relationships, emergency borrowing at unfavorable rates
- Overestimation: Trapped portfolio capital, inflated loan costs, reduced incentive for project teams to manage cost efficiency
In both cases, the underlying failure is the same: the timing of cash movements in the model doesn't match what's actually happening in the field.
Beyond the Finance Function
The financial consequences are visible enough — but accurate forecasting also drives decisions well outside the finance function:
- Surety relationships and bonding capacity decisions
- Bank covenant compliance and credit line management
- Workforce hiring and equipment procurement timing
- Bid decisions (whether the firm has the liquidity to mobilize another project)
How Construction Cash Flow Forecasting Works
Construction cash flow forecasting ties together the project schedule, contract value, earned revenue, billing cadence, retainage terms, and subcontractor payment timing into a single rolling model. The mechanics break down across four project phases and three core steps.
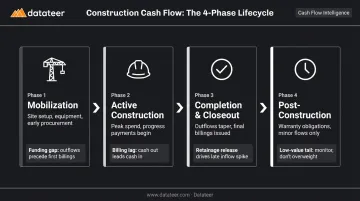
The Four Phases of Construction Cash Flow
Each phase carries different modeling assumptions:
| Phase | Cash Pattern | Key Modeling Consideration |
|---|---|---|
| Mobilization | Moderate outflows, minimal inflows | Funding gap at project start |
| Active Construction | Peak outflows, progress payments begin | Billing lag vs. work performed |
| Completion/Closeout | Outflows taper, final billings released | Retainage release timing |
| Post-Construction | Minor warranty and punch-list flows | Low-value tail, often ignored |
Step 1: Establish the Project Funding Position
Before work begins, identify every cash source and obligation:
- Inflows: Client progress payments, owner draws, mobilization advances
- Outflows: Payroll, materials, subcontractor draws, equipment, overhead allocation
Calculate the net funding position per project. This determines whether a job is over- or under-allocated before the first shovel hits ground — and whether taking it on creates a portfolio liquidity problem.
Step 2: Distribute Cost Across the Schedule Using Curves
The distribution curve you apply determines how early cash availability looks. There are four primary options:
- S-curve: Slow start, heavy middle, long tail — most common in ground-up construction
- Front-loaded: Heavy early spend, typically for upfront material procurement or equipment deposits
- Back-loaded: Major expenses at closeout, such as high-end finishes or commissioning
- Linear: Even monthly spend, typical for rentals or ongoing maintenance services
Selecting the wrong curve isn't a minor calibration issue. It misstates early cash availability and can lead to overborrowing or underfunding critical project phases.
Retainage must be modeled as its own line item. Embedding retainage inside billing projections obscures the gap between earned revenue and actual cash. At 5–10% of every draw, and with 66% of contractors waiting one month or more to collect, that gap compounds quickly across a portfolio.
Step 3: Track Actuals and Reforecast Continuously
A forecast that isn't refreshed against actuals becomes fiction within two weeks. The cost-to-cost method (revenue earned = contract value × costs-to-date ÷ estimated costs at completion) must re-run on live actuals at every billing period to keep over/under billing positions and remaining period projections current.
This is where manual processes break down. The monthly reforecast cycle introduces a 10–20 day lag between period-end and report availability — the data is stale before it reaches the people making decisions.
Datateer's platform eliminates this lag by syncing directly with 12+ construction ERPs (including Procore, Sage, Viewpoint Vista, Acumatica, Foundation Software, and CMiC), refreshing WIP, billings, retainage, and job-level cash flow data automatically. A Double L Management analyst described the shift directly: "That one click replaced two weeks' worth of prior work." The result is a continuously current forecast rather than a monthly snapshot that's outdated on arrival.
Key Factors That Affect Construction Cash Flow Forecasts
Billing Cadence and Payment Terms
The gap between work performed and cash received is the structural driver of construction liquidity problems. Average DSO in construction runs in the 51–83 day range across multiple studies — meaning work billed today may not convert to cash for two to three months.
Forecasts that ignore billing approval cycles, lender draw schedules, or AIA billing cutoff dates will overstate available cash by a material margin.
Retainage Structure and Release Timing
Retainage is a discrete liquidity event, and each variable must be modeled explicitly:
- The withheld percentage (typically 5–10% of each draw)
- The release trigger — substantial completion, final punch-list, or a defined milestone
- Whether release comes in a lump sum or installments
- Public versus private project norms (public projects commonly hold retainage longer)
Each of these variables reshapes the inflow curve. Datateer's dedicated Retainage Tracking module monitors A/R retainage held by owners, A/P retainage held on subcontractors, and release schedules — feeding directly into the 13-week cash flow forecast so the full impact on working capital is visible before it becomes a problem.
Change Order Volume and Timing
Unapproved change orders create a gap between work performed and billable contract value. On complex projects with high change order frequency, that gap compounds quickly.
A more accurate approach treats each pending CO as a probability-weighted line item. Common modeling categories include:
- High probability (>80%): Include at full value in the inflow curve
- Medium probability (40–79%): Apply a weighted discount to the expected cash date
- Low probability (<40%): Hold as a footnote until owner approval
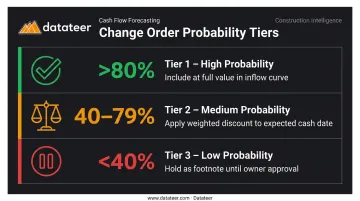
This prevents both overstating inflows (by treating all pending COs as approved) and understating them (by ignoring pending COs entirely).
Pursuit and Backlog Pipeline Visibility
Waiting until contract award to build a cash flow projection forfeits the pre-construction window — McKinsey research shows preconstruction excellence can deliver 20% or more NPV uplift on total installed cost. Weighting pursuit probabilities into the revenue curve extends visibility beyond awarded backlog — reducing the capacity planning mistakes that come from treating signed contracts as the only forward signal.
Labor Cost and Payroll Timing
Weekly payroll is the most rigid outflow in any construction forecast. It cannot be deferred when an owner payment is late. Firms with high direct labor ratios must model payroll dates as fixed obligations and build buffer accordingly — not assume they can float payroll against delayed receivables.
Common Issues and Misconceptions in Construction Cash Flow Forecasting
Treating the WIP Schedule as a Cash Flow Forecast
This is the most common structural error in construction finance. WIP is built for the surety — it reflects last period's earned revenue with no visibility into pursuits, billing lags, or retainage release timing.
Reading WIP to plan cash is making strategic decisions from a forensic document. It tells you where you were at month-end, not where your cash position will be in 60 days.
The Spreadsheet Error Problem
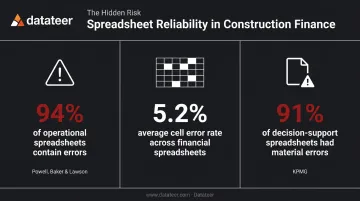
Connecting WIP, billings, retainage, and pursuit data across multiple spreadsheet tabs creates compounding formula risk. Powell, Baker, and Lawson's peer-reviewed literature review found that 94% of operational spreadsheets contain errors, with an average cell error rate of 5.2%. A KPMG audit study cited in the same research found material errors in 91% of 22 decision-support spreadsheets reviewed.
The model is too interconnected for manual maintenance to remain reliable at scale — this is a structural problem, not a discipline one. JBKnowledge's Annual Construction Technology Report found that 44% of construction firms used spreadsheets to transfer data between applications that don't integrate, which multiplies the error surface with every manual handoff.
The Over/Under Billing Misconception
Many teams treat overbilling as available cash. It isn't. Overbilling means you've billed more than you've earned — it's a liability that will either require future work to justify or result in a credit. Underbilling, meanwhile, silently erodes working capital without triggering an obvious alert.
Neither shows up clearly in a bank balance. The gap between billed and earned needs to surface at the project level — not at month-end, but early enough for CFOs to intervene before a margin problem becomes a cash problem.
Key signals teams often miss:
- Overbilling masked as positive cash flow until work falls short of billed progress
- Underbilling accumulating silently across multiple projects before appearing in WIP
- No project-level alert when the billed-vs-earned gap widens mid-cycle
Applying a Single Linear Curve to All Projects
Linear distribution is the default in many firms — and a quiet source of forecast error. Applying it to an S-curve project overstates early cash availability. Applying it to a front-loaded procurement-heavy project understates it. The error compounds across a portfolio.
Datateer's Job-Level Cash Flow dashboard identifies which projects are generating cash and which are consuming it, surfacing liquidity risk mid-project rather than after the billing cycle closes.
Conclusion
Construction cash flow forecasting isn't a deliverable you produce once at project kickoff. It's a living model — one that connects pursuits, backlog, WIP, billing timing, retainage, and subcontractor obligations into a single forward-looking view.
Firms that navigate market disruptions successfully tend to catch warning signals early — liquidity risk identified mid-project, margin fade spotted before it compounds, billing gaps flagged before they become shortfalls. That kind of visibility doesn't come from a post-billing-cycle review. It comes from forecasting infrastructure that runs continuously against live ERP data.
Datateer's 13-week cash flow forecasting dashboards connect directly to your construction ERP — Procore, Sage, Viewpoint, Acumatica, and others — so your finance team sees the full picture without manual assembly. If you want to see how your current data workflow stacks up, the 15-Minute Workflow Audit starts there.
Frequently Asked Questions
What is the difference between cash flow forecasting and cost forecasting in construction?
Cost forecasting answers "what will the work ultimately cost?" while cash flow forecasting answers "when will money actually move?" A project can be on budget and still face a cash crunch if major expenditures arrive before expected inflows — both tools are necessary, but they're not interchangeable.
How do you calculate a cash flow projection in construction?
Start with the total project budget, subtract costs-to-date to get projected cost to complete, then distribute remaining costs across the schedule using the appropriate curve (S-curve, linear, front-loaded, or back-loaded). On the inflow side, layer in billing cadence, payment terms, and retainage release timing to complete the picture.
What is a 13-week rolling cash flow forecast in construction?
It's a weekly-refreshed view of expected cash inflows and outflows over the next quarter — a standard treasury tool for near-term liquidity management. Construction firms can generate it automatically when pursuits, backlog, and WIP share one connected model rather than separate spreadsheets with manual update cycles.
How does retainage affect construction cash flow forecasting?
Retainage withholds 5–10% of every draw until project closeout, creating a persistent gap between earned revenue and actual cash. Any forecast that doesn't model retainage release as a separate line item will consistently overstate available cash, leaving firms exposed to liquidity shortfalls that arrive without warning at year-end.
Why do spreadsheets fail for construction cash flow forecasting?
Linking WIP, billings, retainage, and pursuit data across multiple tabs creates compounding formula error risk — a University of Hawaii study found that 94% of operational spreadsheets contain errors. The manual monthly update cycle also means data is typically 10–20 days stale by the time it reaches decision-makers, so real-time course correction isn't possible.
What role does the WIP schedule play in cash flow forecasting?
The WIP schedule is a backward-looking earned revenue report built for sureties and bonding agents — it tells you what happened last period. Cash flow forecasting tells you what will happen over the next 13 weeks. They serve different purposes and shouldn't be used interchangeably, though construction teams often conflate the two.