Introduction
Construction finance teams sit on mountains of data — schedules, cost codes, labor hours, change orders, pay applications — yet most are still making financial decisions from reports that are two to three weeks old. By the time WIP is finalized and job cost reports are distributed, the project has moved on. That's the rearview mirror problem: you're steering by what happened last month, not what's happening now.
Predictive analytics changes that equation. Instead of describing what already occurred, it uses historical and real-time data to forecast what's likely to happen — flagging cost overruns and cash flow gaps before they become crises.
This guide covers the full picture — what predictive analytics is, how it works, where it creates the most financial value, and how to get started without a data science team.
Key Takeaways
- Predictive analytics forecasts future outcomes — delays, cost overruns, cash risks — not just what already happened
- Where it pays off most: WIP accuracy, margin fade detection, 13-week cash flow forecasting, and budget variance alerts
- Siloed data across ERPs and spreadsheets is why most "predictions" arrive too late to change anything
- Getting started means three things: define what you want to predict, connect your ERP data sources, and use tooling built for construction — not a generic BI tool
- Moving from forensic accounting to forward-looking management protects margins while there's still time to act
What Is Predictive Analytics in Construction?
Predictive analytics uses statistical modeling and historical data to forecast future outcomes — not just describe past ones. That distinction matters. A standard dashboard tells you last month's job cost variance. A predictive model tells you which active projects are trending toward overrun next month.
This is different from the reporting most construction finance teams live in daily. Descriptive analytics answers "what happened." Predictive analytics answers "what will happen." In construction, that gap between the two is where overruns get born — and where they can still be stopped.
Why Construction Is High-Stakes Territory
Construction is an unusually demanding environment for financial forecasting:
- Margins are thin — McKinsey reports typical E&C margins run 5%–7%, which means a single surprise subcontractor overrun can wipe out a quarter's profit
- Projects involve dozens of interacting variables: labor productivity, material costs, subcontractor performance, weather, change order velocity
- KPMG found that 37% of capital projects miss budget and/or schedule targets by 20% or more due to poor risk management
- Long timelines mean small problems compound before they surface in reports
The Maturity Spectrum
Predictive analytics isn't one thing — it's a spectrum:
- Low end: Regression-based cost forecasting from historical job data
- Mid-range: Time series models tracking schedule and cash flow trends
- High end: Machine learning trained on thousands of projects
Most mid-market construction firms can start at the lower end and still see meaningful results. A well-configured regression model — no data science team required — can flag projects trending over budget before month-end close.
How Predictive Analytics Works: From Raw Data to Actionable Insights
The core process runs in four stages: collect, clean, model, and act.
Data is pulled from project systems (ERP, scheduling software, field apps), standardized into a common format, fed into a model that identifies patterns, and delivered as forecasts or alerts.
The quality of the output depends entirely on the quality of the input. Dodge Construction Network found that 46% of US general contractors frequently experience data quality issues — including accuracy, completeness, and consistency problems — which makes clean, automated data pipelines a prerequisite, not a nice-to-have.
Five Techniques Worth Knowing
| Technique | What It Does in Construction |
|---|---|
| Regression analysis | Forecasts cost trends from historical job data |
| Time series analysis | Tracks cash flow and schedule patterns over time |
| Classification models | Flags high-risk projects based on early indicators |
| Clustering | Groups similar jobs to benchmark performance |
| Rule-based alerts | Triggers notifications when thresholds are crossed |
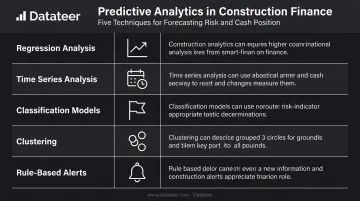
Most construction finance applications start with regression and rule-based alerts. Machine learning comes later, when you have enough clean historical data to train meaningful models.
Deployment Matters as Much as Model Quality
A prediction buried in a PDF emailed on the 15th of the month isn't truly predictive. The financial value comes when models connect to live data and flag issues as they develop — not two weeks after the fact.
That means your analytics layer needs to:
- Pull from ERP and project systems automatically (not via manual export)
- Refresh on a daily or near-real-time schedule
- Deliver alerts into the tools your team already uses — dashboards, email, or mobile
- Tie forecasts to specific projects, cost codes, or PMs — not just company-wide averages
Key Financial Applications of Predictive Analytics in Construction
WIP Report Accuracy and Forecasting
WIP is the heartbeat of construction finance — and it's where predictive analytics pays the most immediate dividends. Predictive models can flag projects where percentage-of-completion estimates are likely to be miscalculated, by comparing current cost-to-complete projections against patterns from similar historical jobs.
The risk here is "WIP fade": over-billings that look healthy today but erode over the project lifecycle, creating a reported profit position that won't survive reconciliation. Early detection changes outcomes. Late detection means restatements — and the lender conversations that follow.
The traditional WIP process typically takes 10–20 days after month-end to produce a complete report — meaning "current" data is already historical by the time finance sees it. That lag is the problem predictive analytics solves.
Datateer eliminates that delay through automated overnight ERP sync, giving finance teams live cost data to feed forecasting models instead of last month's numbers. The WIP dashboard calculates percentage complete, earned revenue, over/under billings, and projected margin per job — pulled directly from the ERP without manual extraction.
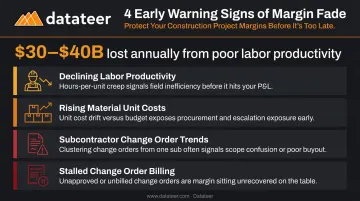
Margin Fade Detection
Margin erosion rarely announces itself. It shows up in aggregate numbers at job close, long after the window to intervene has passed. Predictive analytics identifies the early warning signs:
- Labor productivity declining relative to budget
- Material unit costs drifting above bid estimates
- Subcontractor change orders trending upward
- Stalled change orders where work is done but billing isn't approved
FMI estimated $30–$40 billion is lost annually in US construction from poor labor productivity, with 45% of respondents reporting declining productivity in 2023. That's not a small risk — it's a structural leak that predictive monitoring can catch before it compounds.
Datateer's Margin Protection dashboard tracks original estimated margin versus current projected margin per job. It surfaces the specific cost codes and phases driving deterioration — labor overrun, material escalation, subcontractor cost increases — continuously, not at month-end.
Cash Flow Forecasting
Cash flow surprises are among the leading causes of contractor financial distress. CFMA identifies negative cash flow pressure as the number one cause of contractor failure — and the problem isn't usually that firms don't see it coming, it's that they see it too late.
Predicting a cash shortfall 60–90 days out creates options: accelerate billings, negotiate payment terms, delay discretionary spending. Discovering it at month-end creates emergencies.
A forward-looking cash flow model combines:
- Billing schedules and pay application timing
- Retainage release schedules
- Project burn rates and committed costs
This gives leadership a projected working capital position weeks ahead of the crisis point. Datateer's 13-Week Cash Flow Forecasting module feeds directly from ERP data, replacing estimated positions with actual liquidity visibility.
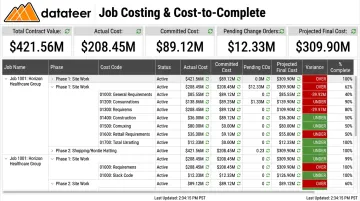
Budget Variance and Cost-at-Completion Alerts
The traditional estimate-to-complete process is a monthly ceremony: the CFM pulls cost data, rebuilds the ETC in Excel, compares it to original budget, and publishes a report that's already aging by distribution.
Predictive models generate a cost-at-completion forecast that updates continuously as actual costs post — turning budgeting from a monthly event into a live control mechanism. Datateer's Job Costing & Cost-to-Complete dashboard tracks actual costs, committed costs (POs, subcontracts), pending change orders, and projected final cost at the job, phase, and cost-code level, without requiring manual rebuilds.
Bid Profitability Prediction
Most firms collect this data but never analyze it systematically. The patterns are there:
- Which project types consistently produce better margins
- Which geographies underperform bid expectations
- Which contract structures generate the most change order disputes
Analyzing those patterns sharpens go/no-go decisions and bid pricing. McKinsey documented one US infrastructure owner that used multivariate statistical models to cut contract-price assessment time from 60 days to just 2 days. The difference between gut-feel bidding and evidence-based bidding comes down to whether that historical data gets used.
The Data Problem: Why Most Firms Aren't Getting Full Value
The Silo Problem
Most construction firms run financial data across multiple disconnected systems: one ERP for costs, a separate scheduling tool, spreadsheets for WIP, field apps for time tracking. FMI reported that 30% of E&C companies use applications that don't integrate with each other, and 95.5% of captured data goes unused.
Predictive models are only as good as their inputs. When those inputs come from five disconnected systems, the outputs reflect that fragmentation — sometimes dangerously so.
The Lag Problem
WIP reports typically take 10–20 days to produce after month-end. A predictive model fed that data isn't forecasting the future — it's describing a past that's already three weeks old. Useful forecasting requires:
- Data refreshed daily or weekly, not monthly
- Automated feeds that bypass the manual close cycle
- A system that surfaces variance as it develops, not after the fact
The Standardization Problem
Inconsistent cost coding across projects makes it nearly impossible for a predictive model to find meaningful patterns. When divisions use different cost code structures, or superintendents apply codes inconsistently, a model trained on that data produces apples-to-oranges predictions.
Datateer's automated data extraction and cleaning engine solves this at the source: standardizing cost codes across systems, catching broken entries, and mapping the firm's unique data logic into a unified structure. Cross-project comparisons only produce reliable signals when the underlying coding is consistent.
The Spreadsheet Trap
Firms managing WIP and job cost in Excel are structurally cut off from predictive analytics. The data lives in files, not in a connected system a model can query. Manual processes also introduce error: one peer-reviewed study of 50 operational spreadsheets found 94% contained errors, with formula-cell error rates between 0.9% and 1.8%.
Datateer supports CSV uploads alongside automated ERP feeds, so firms can migrate gradually: maintaining manual inputs during transition while the automated layer handles core WIP and job cost calculations.
What "Data Ready" Actually Looks Like
You don't need a data science team to get predictive value. You need:
- A single source of truth connected to your ERP
- Standardized cost codes across projects
- Consistent data entry practices in the field
Datateer's 2–4 week implementation is built around these requirements — automated extraction, cleaning, and normalization happen as part of setup, not as prerequisites for it.
How to Get Started with Predictive Analytics in Construction
Step 1 – Define the Financial Outcome You Want to Predict
The most common mistake is starting with the technology. Start with the business question instead.
Pick one specific, high-value outcome: cash flow shortfalls, margin fade on active jobs, WIP overbilling risk. Going broad early produces noise, not insight. Once you get a working model on one outcome, expanding is straightforward.
Step 2 – Connect and Clean Your Data Sources
Predictive value requires connecting the ERP (actual costs), scheduling system (timeline risk), and field data (labor productivity) into a unified data layer. The manual extraction step — exporting CSVs, running VLOOKUPs, reconciling Procore to Sage — is typically the biggest bottleneck.
Datateer's integrations with Procore, Sage, Viewpoint Vista, Viewpoint Spectrum, Acumatica, Foundation Software, CMiC, Jonas Construction, QuickBooks, NetSuite, and custom systems eliminate that step entirely. Data flows automatically, overnight.
Step 3 – Choose Tools Built for Construction Finance
Generic BI tools require heavy customization to handle construction-specific logic: WIP, over/under billing, cost-to-complete, retainage, ASC 606. That customization takes months and requires technical resources most construction firms don't have.
Construction-specific platforms come pre-built with these models. Datateer delivers 12 dashboards on day one, mapped directly to construction ERP data models and ready to use without any configuration. Coverage includes:
- WIP and over/under billing
- Cash flow and 13-week liquidity forecasting
- Margin protection and job costing
- Change order aging and retainage tracking
Pricing starts at $10,000/year per data source, with unlimited users and no per-seat or per-dashboard fees.
Step 4 – Build the Habit of Acting on Predictions
Predictive analytics requires a real workflow shift: from monthly financial reviews to weekly (or daily) monitoring of leading indicators. The finance team stops reporting history and starts functioning as an active project advisor, flagging problems while there's still time to act.
Frequently Asked Questions
What types of data are needed for predictive analytics in construction?
The core inputs are ERP cost data, project schedules, labor productivity records, subcontractor performance history, and material pricing. Data quality matters more than volume; a smaller, clean dataset produces more reliable forecasts than a large, inconsistent one.
How is predictive analytics different from a standard construction dashboard?
Dashboards show what has already happened (descriptive analytics). Predictive analytics uses that historical data to forecast what's likely to happen next — surfacing risks before they materialize, not after they've already hit your margin.
Can small and mid-size construction firms ($10M–$200M) use predictive analytics?
Yes. Cloud-based, construction-specific platforms have made this accessible to firms in this range without requiring an internal data science team. Datateer, for example, is built for firms in this range — pre-built dashboards, no data science team required, and support for firms from $10M to $1B+.
What are the biggest implementation challenges?
Three barriers come up consistently: fragmented data across disconnected systems, inconsistent cost coding that undermines cross-project comparisons, and reporting lags of 10–20 days that leave models working with stale inputs. Platforms with automated ERP integration and built-in data standardization tackle all three.
How does predictive analytics help prevent cost overruns?
Predictive models track leading indicators — labor productivity trends, change order velocity, cost-vs.-budget trajectory — and surface alerts when a project is trending toward overrun. That early warning creates time for the PM or CFM to intervene, rather than discovering the overrun at job close.
What is the difference between predictive analytics and AI in construction?
AI (specifically machine learning) is one set of techniques within predictive analytics — not the whole of it. Statistical regression and rule-based forecasting are simpler, widely used forms that don't require machine learning. Most construction finance applications start there, scaling to ML only when pattern complexity across large multi-project datasets demands it.