The numbers back this up. McKinsey's 2023 capital-project analysis found that cost overruns averaged at least 79% relative to initial budget estimates. Meanwhile, KPMG's 2023 Global Construction Survey found that 37% of project owners missed budget or schedule targets by 20% or more due to insufficient risk management.
Construction projects face layered financial risk that other industries don't: long timelines, fluctuating labor and material costs, change orders, and back-loaded billing cycles. Profitability can erode silently across months while the books look fine.
This guide covers what construction project profitability analysis actually is, the metrics that matter, a repeatable six-step process, and what good analysis looks like when it's working.
Key Takeaways
- Profitability analysis is an ongoing, in-flight process — not a post-mortem review at project close
- The core metrics are gross profit margin, net profit margin, cost variance, WIP-based gain-fade, and cash flow KPIs
- Timely data is the difference between proactive margin protection and forensic accounting
- The six-step process runs from scope definition through acting on insights — and repeats every reporting cycle
- Automated ERP-to-dashboard data flow closes the reporting lag — so analysis drives decisions, not just documents them
What Is Construction Project Profitability Analysis?
Construction project profitability analysis is the structured process of evaluating a project's actual financial performance — revenue earned versus costs incurred — against the original estimate, at any point during or after the project lifecycle. Unlike transactional bookkeeping, the goal is insight and course correction, not just record-keeping.
It operates at two levels:
- Job-level analysis examines each project's gross profit, cost variance, and margin trends individually
- Portfolio-level analysis compares profitability patterns across project types, clients, regions, or crews to inform bidding and resource allocation decisions
Reactive vs. Proactive Analysis
Most firms do profitability analysis reactively — they look at what happened after a project closes. By the time the report is ready, the margin is already gone.
Proactive, in-flight analysis catches erosion while there's still time to act. A cost variance flag at 40% completion gives a finance manager leverage: revise the estimate, submit a change order, reallocate crew. The same finding at 95% completion is just documentation.
This guide focuses on building the proactive version — and the tools below are what make that possible.
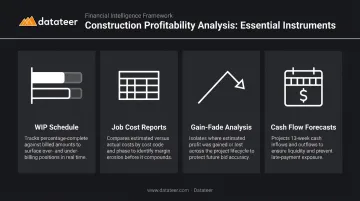
The Right Tools for Construction Finance
Standard P&L statements don't give you enough. The primary instruments for construction profitability analysis are:
- WIP (Work-in-Progress) schedule — tracks estimated vs. actual profit on active jobs using percentage of completion
- Job cost reports — cost-to-date broken down by labor, materials, subs, and equipment
- Gain-fade analysis — trends in estimated gross profit across reporting periods
- Cash flow forecasts — projected inflows and outflows over the project lifecycle
Key Metrics and KPIs for Construction Project Profitability
Gross Profit Margin
Formula: (Revenue − Direct Costs) ÷ Revenue
Direct costs include labor, materials, subcontractors, and equipment. This metric tells you whether a project is priced correctly to cover its production costs. Track it per project — blended company-level margins can mask one or two jobs dragging down the portfolio without surfacing in blended numbers.
Net Profit Margin
Formula: (Revenue − All Costs including overhead allocation) ÷ Revenue
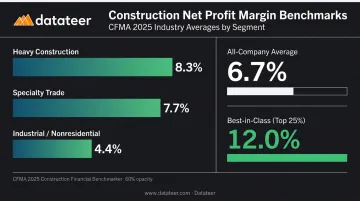
This reflects true project profitability after absorbing overhead: G&A, insurance, bonding, office costs. According to the CFMA's 2025 Construction Financial Benchmarker (using fiscal year 2024 data from 1,558 companies), the all-company net income before taxes margin was 6.7%. Best-in-class performers — the top 25% — hit 12.0%.
Segment averages from the same report:
- Heavy Construction: 8.3%
- Specialty Trade: 7.7%
- Industrial/Nonresidential: 4.4%
These benchmarks vary by firm size and region. Tracking your own firm's historical margin by project type is more actionable than chasing an industry average.
Cost Variance
Formula: (Planned Budget × % Complete) − Actual Costs to Date
This is the primary early-warning metric. A negative cost variance at 40% completion signals a project trending toward overrun — when you can still do something about it. Breaking cost variance down by trade, crew, or cost code isolates the specific driver: labor inefficiency, a material price spike, subcontractor performance, or scope creep from unapproved change orders.
WIP Schedule and Gain-Fade Analysis
The WIP schedule is construction's primary in-flight profitability tool. It tracks estimated vs. actual profit on each active job using percentage of completion — enabling revenue recognition as costs are incurred relative to total estimated project cost.
Gain-fade tracks the trend in estimated gross profit across successive reporting periods. A fade — declining projected profit from one period to the next — signals cost overruns or estimate inaccuracies. EisnerAmper describes the WIP schedule as the "holy grail" for bonding companies reviewing construction financials. Sureties scrutinize consistent or unexplained fade and may penalize contractors who repeatedly overstate profits on uncompleted jobs.
Gain-fade analysis should be performed monthly at minimum.
Cash Flow KPIs
A construction company can be profitable on paper and still face a liquidity crisis. Front-loaded costs, back-loaded billings, and retention holdbacks create timing gaps that don't show up in margin metrics. Monitor three indicators alongside margin data:
- Net Cash Flow — cash in minus cash out for the period
- Projected Cash Flow — anticipated inflows and outflows over the project's remaining life
- Working Capital — current assets minus current liabilities
A firm with strong margins but poor cash timing can still miss payroll. Margin data and cash flow indicators need to be reviewed together, not in separate meetings.
How to Conduct a Construction Project Profitability Analysis: Step by Step
Most firms analyze profitability too late — at project close, when findings inform the next bid but can't rescue the current job. This process is designed to run continuously throughout a project's lifecycle.
Step 1 – Define the Analysis Scope
Establish what's being analyzed: a single project, a phase, a specific trade package, or a portfolio of active jobs. Set the time period and the baseline estimate you're measuring against. One of the most common analysis errors is comparing actuals to an outdated or unrevised estimate — the baseline must be current.
Step 2 – Gather Financial Inputs
You need data from multiple sources:
- ERP or accounting system — cost-to-date, billed revenue, payables
- Project management system — schedule and percent complete
- Timesheets — labor hours and rates by cost code
- Change order log — approved vs. pending vs. denied
ERP data lag is a structural problem in construction finance. There's often a gap of days or weeks between when a cost is incurred and when it appears in a report. Incomplete or delayed data at this stage degrades everything downstream. Autodesk and FMI research estimated that bad construction data — inaccurate, incomplete, or untimely — cost the global industry $1.85 trillion in 2020.
Step 3 – Organize and Standardize the Data
Raw data from multiple systems rarely lines up cleanly. This step covers three specific tasks:
- Standardize cost codes across projects so labor and materials comparisons are apples-to-apples
- Confirm revenue recognition method — percentage-of-completion and completed-contract recognize profit at different points, and mixing them distorts results
- Reconcile the WIP schedule against ERP data to confirm the two are in sync before any calculations run
Step 4 – Calculate Key Profitability Metrics
Run the core calculations:
- Gross profit per project
- Cost variance by cost code
- Estimated cost to complete (ETC)
- Revised profit at completion
- Gross margin %
Estimated cost to complete is the most forward-looking number on this list. It's the field team's projection of remaining costs — and when it diverges significantly from the original plan, that gap signals trouble before the damage is done. Don't wait for month-end to investigate a large ETC variance.
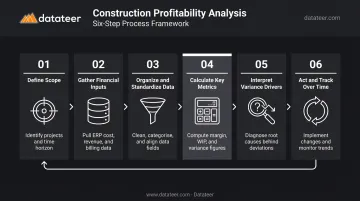
Step 5 – Interpret Results and Identify Variance Drivers
The goal of this step is diagnosis, not just measurement. When a cost variance or margin fade appears, trace it to a specific cause. Common drivers include:
- Underbid on labor hours or material quantities
- Labor inefficiency or rework on a specific trade
- Material cost escalation since the original bid
- Unapproved change orders absorbing scope without revenue
- Subcontractor performance issues
- Billing delays creating cash timing problems
Compare results across similar project types to distinguish a one-off issue from a systemic pattern. If labor overruns appear on three consecutive jobs of the same type, that's an estimating problem, not bad luck.
Step 6 – Act on Insights and Track Over Time
Findings translate into specific decisions:
- Revise estimates and forecasts
- Issue change orders for scope added without authorization
- Renegotiate subcontractor terms or replace underperformers
- Adjust crew assignments or accelerate the schedule
- Flag a project for executive escalation if the fade is severe
Track gain-fade across reporting periods — not just at one snapshot. This shows whether corrective actions are working and whether the firm's estimating accuracy is improving over time. Each completed project adds to the firm's historical database — and firms that close this loop consistently tend to win more profitable work, because their estimates reflect what jobs actually cost.
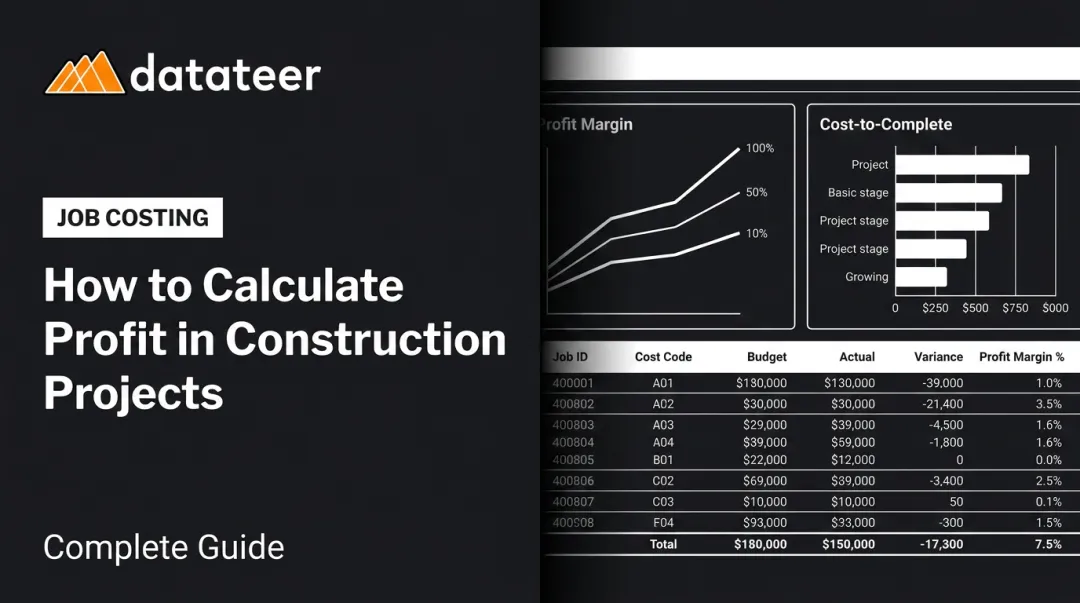
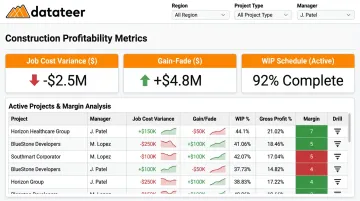
Construction Profitability Analysis in Practice: A Practical Example
A mid-size general contractor is 50% complete on a commercial fit-out, originally bid at a 12% gross margin. The finance manager pulls a mid-project profitability report.
Here's what the analysis surfaces:
| Metric | Original Estimate | Current Actuals | Variance |
|---|---|---|---|
| Gross Margin | 12% | 7.5% | −4.5 pts |
| Labor Cost | On plan | +18% over plan | −$142K |
| Materials | On plan | On plan | $0 |
| Estimated Profit at Completion | $186K | $116K | −$70K |
The cost variance calculation flags the labor overrun. The WIP schedule shows the estimated profit at completion has faded from 12% to 7.5%. The cost code breakdown isolates the specific trade package causing the slippage — one subcontractor's rework on a mechanical rough-in.
The finance manager can now go directly to the project manager with data, not questions. At 50% completion, the options are still open:
- Revise the estimate to reflect current labor reality
- Compress the remaining schedule to recover lost margin
- Submit a change order if the rework stemmed from a design error outside original scope
A firm that catches this at 50% can act on it. A firm that discovers it at final billing can only document it. The data from this job also updates the firm's historical estimating database, improving bid accuracy on future commercial fit-outs.
How Datateer Supports Construction Profitability Analysis
Datateer is a financial analytics platform built specifically for construction firms. It integrates directly with 12+ construction ERPs — including Procore, Sage, Viewpoint Vista, Acumatica, Foundation Software, and CMiC — and automatically syncs job cost data, WIP schedules, and margin metrics into executive dashboards overnight.
That eliminates the 10-20 day reporting lag that makes profitability analysis stale before it reaches leadership.
The profitability-specific capabilities include:
- Real-time cost variance tracking by project, phase, and cost code — drill down to the source ERP transaction to see exactly where costs went
- Automated gain-fade reporting monitors original estimated margin vs. current projected margin per job, flagging the specific cost codes driving deterioration
- WIP schedule automation calculates percentage complete, earned revenue, billed/unbilled amounts, and projected margin per job — replacing month-end CSV exports and VLOOKUP marathons
- Cost-to-complete analytics covering actual costs incurred, committed costs (POs and subcontracts), pending change orders, and projected final cost in one view
- CFOs can compare margin performance, cost variance, and gain-fade across all active jobs simultaneously — no spreadsheet consolidation required
One Double L Management team member put it plainly: "The very first time we accessed our data through a Datateer analytics dashboard, that one click replaced two weeks worth of prior work."
Datateer serves construction firms from $10M to over $1B in revenue, with flat annual pricing starting at $10,000/year per data source and unlimited users. Setup takes 2-4 weeks, and annual fees don't begin until data is flowing.
The free 15-Minute Workflow Audit is the fastest way to see exactly where your current reporting process is costing you time — no slides, no sales pitch.
Frequently Asked Questions
How do you measure project profitability?
Project profitability is measured by comparing revenue earned to total costs incurred — labor, materials, subs, and overhead — using metrics like gross profit margin, net profit margin, and cost variance. For in-flight measurement on active jobs, the WIP schedule is the primary construction-specific tool, using percentage of completion to calculate earned revenue and projected margin.
What is the average profit margin on a construction project?
According to the CFMA's 2025 Construction Financial Benchmarker (fiscal year 2024 data), the all-company net income before taxes margin was 6.7%, with Best-in-Class firms hitting 12.0%. By segment: Heavy Construction 8.3%, Specialty Trade 7.7%, Industrial/Nonresidential 4.4%. Margins vary by firm size, project type, and region — your own historical data by project type is more useful than chasing an industry average.
What are the five key profitability ratios in construction?
The five most relevant ratios:
- Gross profit margin — revenue minus direct costs
- Net profit margin — revenue minus all costs including overhead
- Return on investment — net profit relative to invested capital
- Profitability index — present value of future cash flows relative to initial investment
- Working capital ratio — current assets vs. current liabilities as a liquidity health indicator
What is gain-fade analysis in construction?
Gain-fade tracks the trend in estimated gross profit on a job across successive reporting periods. A "fade" is a decline in projected profit from one period to the next — signaling cost overruns or estimating inaccuracies. Bonding companies scrutinize consistent or unexplained fade, and sureties may penalize contractors who repeatedly overstate profits on uncompleted work.
What causes construction projects to lose profitability?
The most common causes: inaccurate initial estimates, unmanaged scope creep, labor inefficiency, material cost escalation, subcontractor underperformance, billing delays, and lack of real-time cost visibility. Most of these surface early enough to correct — if you're reviewing job costs in real time rather than after the project closes.
How often should construction companies run a profitability analysis?
Active projects should be reviewed monthly at minimum, aligned with the billing cycle. High-risk or high-value jobs warrant bi-weekly reviews. Firms with ERP-connected dashboards can monitor continuously, making frequency less the constraint than data freshness.