By the time leadership sees the numbers, the project has moved on. The damage is done.
This article covers what a construction analytics dashboard actually is, which financial KPIs it must track, what separates a useful platform from a generic BI tool, and how the right dashboard shifts a finance team from reactive reporting to proactive profit protection.
Key Takeaways
- Construction firms average a 6.7% net income margin — one slow-moving project with late financial visibility can erase months of hard-won profit
- The traditional WIP cycle creates a 10–20 day lag between when problems develop and when leadership sees them
- A construction analytics dashboard replaces manual compilation with automated, real-time financial KPIs
- The five metrics that most predict profitability: WIP position, job cost variance, margin fade, labor performance, and cash flow/AR aging
- Platforms like Datateer deliver pre-built construction financial logic (WIP, over/under-billing, margin fade) without months of custom development
What Is a Construction Analytics Dashboard?
A construction analytics dashboard is a centralized interface that pulls financial and operational data directly from a firm's ERP and connected systems, transforms it into visual KPIs, and gives finance leaders an always-current view of company and project health — no manual compilation required.
Unlike a spreadsheet report, it doesn't wait for a monthly close cycle or require a controller to export CSVs and run VLOOKUPs. Data flows automatically from the ERP, and metrics stay current.
How It Differs from Legacy Approaches
Traditional construction finance relies on a few tools that introduce dangerous lag:
- Spreadsheets break formulas, invite human error, and freeze the moment someone last saved them
- WIP reports compiled two to three weeks after period-end describe a financial reality that no longer exists
- Siloed systems scatter cost data across the ERP, time-tracking tools, AP workflows, and revenue spreadsheets — each handoff adding delay
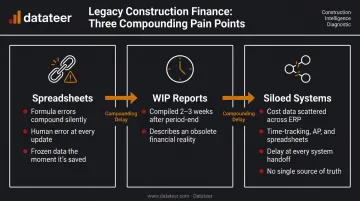
Each handoff between systems introduces delay and error. By the time leadership reviews the compiled report, corrective action on the underlying project is often impossible.
Finance Dashboard vs. Project Management Dashboard
This distinction matters. Project management dashboards — think Procore's schedule views — track field activity, milestones, and RFIs. They're built for superintendents and project managers coordinating work in the field.
A construction analytics dashboard built for finance teams focuses on different questions entirely:
- Is this project making money?
- Are we billing ahead of or behind our earned revenue?
- Where is our cash stuck?
- Which jobs are pulling down the portfolio's margin?
Job cost, cash flow, margin performance, and billing health are what determine whether the company is profitable — and those are the metrics a financial analytics dashboard is built to surface.
Why Construction Finance Teams Struggle Without Real-Time Analytics
The core problem is structural. Construction financial data doesn't live in one place.
Project cost data lives in the ERP. Labor hours come from a time-tracking system. Subcontractor invoices sit in a separate AP workflow. Revenue projections live in an executive's spreadsheet. Reconciling all of this manually takes time — and time is exactly what finance teams don't have.
The WIP Lag Problem
In most construction firms, the monthly WIP report requires a controller or CFM to manually pull cost data, reconcile it against billings, adjust for percent-complete estimates, and format it in Excel. That process can take two to three weeks — which means leadership is regularly reviewing information that was already obsolete before they opened the file.
Datateer describes this as the "10–20 day WIP lag": the gap between when financial problems develop on a project and when leadership actually sees them. By the time margin fade shows up in the monthly WIP report, the project has moved forward. The window for corrective action has closed.
The Consequences of Late Visibility
The stakes are real. According to the CFMA's 2025 Construction Financial Benchmarker, the typical construction firm runs on a 6.7% net income margin — with top-quartile firms reaching 12.0%. That gap between average and best-in-class is largely a margin-protection story. When overruns go undetected for weeks, there's no recovery.
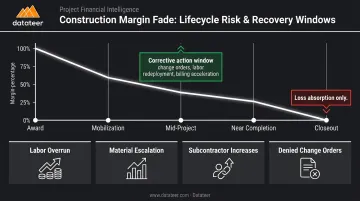
Margin fade — the gradual erosion of a project's gross margin from award to completion — unfolds over weeks. The timing of detection determines the outcome:
- Caught mid-project: Teams can renegotiate change orders, adjust labor deployment, or accelerate billing
- Caught at closeout: The only option is absorbing the loss
The Forensic Accounting Trap
Beyond the lag itself, there's a talent problem. CFMs at construction firms often spend the majority of their time looking backward — compiling reports about what already happened rather than analyzing trends, forecasting cash, and advising project teams.
Datateer calls this the "Excel Autopsy" problem: finance professionals doing forensic accounting on problems that have already occurred, instead of preventing them. The pattern is familiar across construction firms:
- Wednesday data-gathering that consumes most of a controller's day
- Leadership meetings where everyone knows the numbers are three weeks old
- Late nights reconciling Procore commits to Sage invoices with no time left for analysis
That grind doesn't just cost hours. It diverts financial talent from forecasting, project advisory, and the strategic work that actually moves the business forward.
Key Financial KPIs Your Construction Analytics Dashboard Must Track
WIP and Over/Under-Billing
The WIP schedule is the financial backbone of a construction firm. As AICPA/CIMA describes, it calculates the progress and value of ongoing work at a point in time — enabling revenue recognition and accurate financial performance reporting.
The critical outputs are over-billing and under-billing positions:
- Overbilled — billed more than earned; a liability that can mask cash flow problems
- Underbilled — earned more than billed; a receivable that hasn't been collected, straining liquidity
The CFMA 2025 Benchmarker reports average underbillings-to-equity of 8.1% across US construction firms — a meaningful drag on working capital that goes unmanaged when WIP is only visible at month-end.
When WIP updates daily instead of monthly, finance teams can act on billing gaps before they become cash flow problems — not after the close cycle reveals them.
Job Cost Variance (Budget vs. Actual)
A construction analytics dashboard should surface cost variance at multiple levels — not just a lump-sum "over budget" number. That tells a project manager nothing actionable. Knowing labor is running 14% over on Phase 3 while materials track on budget tells them exactly where to look.
Variance should be visible across:
- Job and project phase
- Cost code
- Cost type: labor, materials, subcontractors, and equipment
Gross Margin by Project and Margin Fade Tracking
Margin fade is the gradual decline in a project's expected profit from award to completion. A dashboard should show margin trajectory over time, not just a point-in-time snapshot, so finance and operations leaders can see whether a project is converging toward or diverging from its target margin while there's still time to act.
Datateer's Margin Protection module monitors original estimated margin versus current projected margin per job and flags the specific cost codes driving the deterioration: labor overrun, material escalation, subcontractor increases, denied change orders.
Labor Productivity and Labor Cost Performance
Labor is the highest-risk cost category on a construction project. BLS reported a 6.1% productivity gain industry-wide in 2024, but that aggregate trend masks wide variance at the job level.
A dashboard that surfaces labor slippage weekly gives project managers the ability to address crew performance or scope creep before it compounds. Datateer's Labor & Materials Productivity dashboard tracks hours per unit — so firms can identify which crews are losing hours on Tuesday, not three weeks after payroll clears.
Cash Flow, AR Aging, and Liquidity Indicators
A construction firm can carry a healthy backlog and still face a cash crisis. Slow payments cost the US construction industry approximately $280 billion annually, and the CFMA 2025 Benchmarker puts average days in accounts receivable at 55.2 days — with only 27 days of cash on hand.
That math leaves almost no buffer. A financial dashboard should include:
- Cash flow forecasting (Datateer's Forecasted Liquidity dashboard projects bank balance six months out)
- Accounts receivable aging by client
- Days sales outstanding, tracked as a leading indicator before liquidity pressure becomes a crisis
- Retainage tracking, since withheld amounts of 5–10% of contract value represent real cash that won't arrive until project close
What to Look for in a Construction Analytics Dashboard
Not all dashboards are equal. Here's what separates platforms that actually change how a finance team operates from tools that just create a prettier spreadsheet.
Direct ERP Integration (Not CSV Imports)
This is the baseline requirement. Dashboards that rely on manual data exports or scheduled batch CSV imports immediately reintroduce the lag and error problems they're supposed to eliminate.
Direct, automated ERP sync — supporting the construction ERPs a firm already uses — is the only way to guarantee clean, current data. Datateer integrates directly with 12+ construction ERPs including Procore, Sage 100/300/Intacct, Viewpoint Vista, Viewpoint Spectrum, Acumatica Construction, Foundation Software, CMiC, Jonas Construction, QuickBooks, and NetSuite. Data refreshes overnight as standard, replacing the two-week WIP compilation cycle with a process that requires no manual intervention.
Pre-Built, Construction-Specific Financial Templates
A general-purpose BI tool like Power BI or Tableau can technically display any data. But building construction-specific financial logic — WIP calculations, cost code mapping, margin fade tracking, over/under-billing — from scratch requires months of custom development and deep construction accounting knowledge.
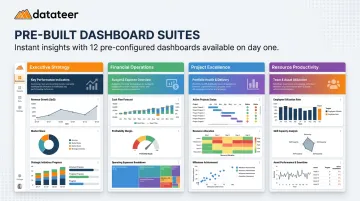
Purpose-built platforms deliver this logic out of the box. Datateer ships 12 pre-built dashboards across four strategic suites on day one, all fully mapped and ready to use:
| Suite | Dashboards Included |
|---|---|
| Executive Strategy & Solvency | Return on Assets/Equity/Revenue, Forecasted Liquidity, Cash Conversion & Velocity |
| Financial Operations & Cash Management | AR & AP Health, WIP & Financial Truth, Job-Level Cash Flow |
| Project Excellence & Field Operations | Project Cost Performance, Budget vs. Actuals, PM Scorecard |
| Resource Productivity | Labor & Materials Productivity, Subcontractor Performance, Equipment Utilization |
Role-Based Views for Different Stakeholders
A construction analytics dashboard needs to serve multiple audiences with different information needs:
- The CFO wants portfolio margin, cash flow outlook, and liquidity risk
- The project manager wants job cost by cost code and labor variance
- The owner wants a weekly financial scorecard
Datateer organizes its dashboards into four strategic views aligned to these different audiences — Executive, Financial Operations, Project Performance, and Resource Productivity — so each stakeholder sees the view relevant to their decisions, rather than forcing everyone to navigate the same dense report.
Exception-Based Monitoring
Effective platforms don't wait for users to find problems — they flag them automatically. Conditions that cross defined thresholds trigger alerts: cost variance exceeding a set percentage, a project becoming underbilled beyond a set amount, AR aging past a limit.
Datateer's Margin Protection analytics continuously monitor original estimated margin versus current projected margin per job. The specific drivers of deterioration surface as they develop, replacing month-end forensic analysis with continuous in-progress oversight.
How a Construction Analytics Dashboard Drives Growth and Profitability
Protecting Margins While There's Still Time
The most direct profitability impact is simple: catching margin erosion on active projects while corrective action is still possible. Change orders can be renegotiated. Labor deployment can be adjusted. Billing cycles can be accelerated. None of that happens when the problem surfaces at project closeout.
Autodesk's 2024 construction data study found that data leaders achieve a 50% higher average profit growth rate annually compared to firms in the beginner category. The mechanism is exactly this: earlier visibility on financial performance creates more opportunities to intervene.
Shifting the Finance Team from Data Gatherer to Strategic Advisor
Eliminating manual WIP compilation saves time. More importantly, it changes what the finance team does with that recovered capacity.
A Double L Management business analyst described Datateer's impact this way: "That one click replaced two weeks worth of prior work." When two weeks of manual effort collapse into one click, finance teams can redirect that time toward work that actually moves the business:
- Cash flow forecasting and liquidity scenario planning
- Bid margin analysis by project type, client, and geography
- Project financial reviews that surface trends before closeout
- Advising leadership on which project types and clients generate the best returns
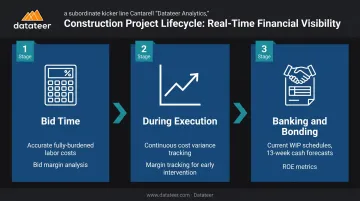
Better Decisions Across the Project Lifecycle
Real-time financial visibility improves decision quality at every stage:
- At bid time — overhead and burden rate analytics calculate actual fully-burdened labor costs by craft and compare budgeted versus actual rates, feeding more accurate bid estimates based on real performance data
- During execution — continuous cost variance and margin tracking enable earlier intervention on projects showing cost pressure
- In banking and bonding conversations — current WIP schedules, 13-week cash flow forecasts, and return on equity metrics make for more confident conversations with lenders and sureties, without the four-hour board prep session
Frequently Asked Questions
What is a construction analytics dashboard?
A construction analytics dashboard is a real-time, centralized interface that pulls data from a construction firm's ERP and connected systems to display financial and operational KPIs. Finance leaders get a live view of project and company health instead of waiting for static month-end reports.
What are the 5 key performance indicators for a construction analytics dashboard?
The five KPIs that most directly predict construction firm profitability:
- WIP and over/under-billing position — flags revenue timing risk before it compounds
- Job cost variance (budget vs. actual) — shows where overruns are developing
- Gross margin by project and margin fade trajectory — catches eroding jobs early
- Labor cost performance — identifies crew-level productivity gaps
- Cash flow with AR aging — surfaces liquidity risk before it becomes a crisis
Each metric surfaces financial risk while there's still time to act.
What are the 4 types of dashboards?
The four standard dashboard types are operational (day-to-day monitoring), strategic (executive/portfolio-level), analytical (trend and pattern analysis), and tactical (action-oriented, for specific decisions). A strong construction analytics platform delivers all four depending on the viewer's role: executives see portfolio health, project managers see job-level cost performance.
What is the 5-second rule for dashboards?
The 5-second rule states that a well-designed dashboard should communicate its most critical insight within five seconds of viewing. For construction finance, that means projects over budget, underbilled positions, and cash flow risk should be immediately visible without scrolling or clicking through menus.
How does a construction analytics dashboard connect to your ERP?
The best construction analytics dashboards use direct automated integration with the firm's ERP to pull cost, billing, and labor data — no CSV exports, no manual reconciliation. Datateer connects directly to 12+ construction ERPs including Sage, Vista, Procore, and Acumatica, with automated overnight data syncing.
How long does it take to set up a construction analytics dashboard?
Purpose-built construction analytics platforms with pre-built ERP integrations and pre-configured financial templates can have data flowing and dashboards live within two to four weeks. Datateer's implementation involves automated data extraction and cleaning, cost code standardization, and full dashboard mapping — with the annual subscription starting only after data is flowing.