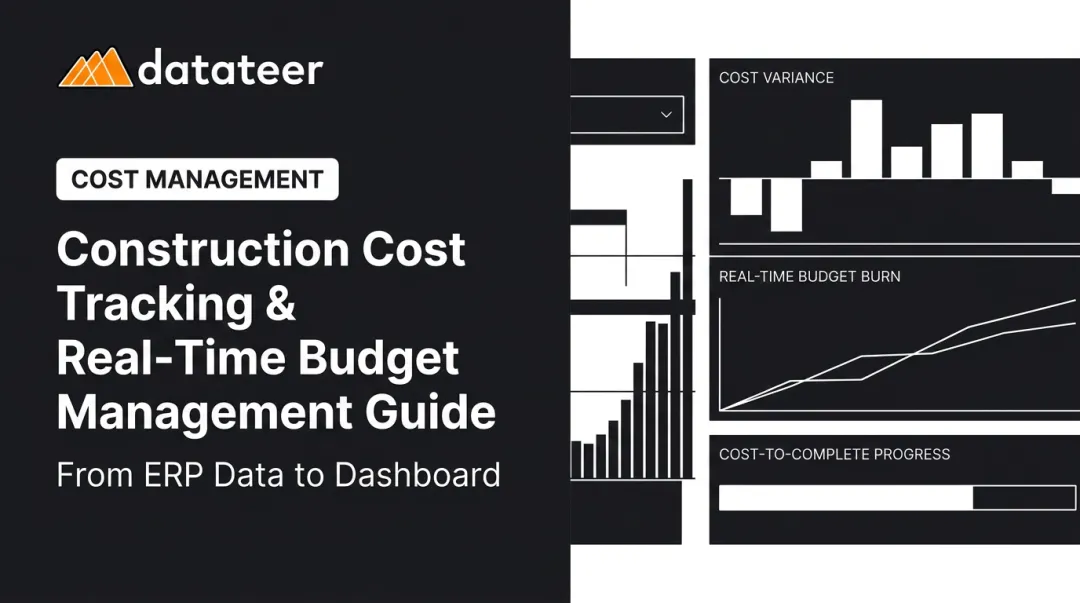
Introduction: Why Your Construction Budget Tracking Needs an Upgrade
Here's a scenario most construction finance managers know well: it's week three of the month, and you're still compiling last month's WIP report. By the time leadership sees the numbers, the data is already 10–20 days old — and whatever margin problem those numbers reveal? The window to fix it has already closed.
This is the core failure of manual budget tracking in construction. It's not that the work isn't done carefully. It's that the process itself creates a structural lag between what's happening on a job site and what decision-makers can see.
This guide is written for construction CFOs and finance managers who are ready to move beyond spreadsheets. We'll cover what automated budget tracking actually looks like in practice, which processes deliver the most value when automated first, and how to evaluate solutions without committing to a months-long IT project.
The payoff goes beyond saved hours. When budget data flows automatically from your ERP to your dashboards, your finance team spends less time assembling reports and more time acting on what those reports reveal — before the margin problem becomes unrecoverable.
Key Takeaways
- Manual WIP reports create a 10–20 day lag that leaves leadership making decisions on stale data
- Automated budget tracking connects your ERP to dashboards that refresh daily — no spreadsheet work required
- The highest-value processes to automate: WIP reporting, budget-vs.-actual tracking, cost code standardization, and margin fade monitoring
- The right solution connects to your existing ERP, delivers pre-built dashboards on day one, and goes live in weeks
- Construction firms that automate catch overruns while there's still time to act — and free finance teams for work that actually requires judgment
Why Manual Budget Tracking Breaks Down in Construction
The Complexity Problem
Construction budgets are unlike almost any other industry's financial tracking challenge. A single project involves dozens of moving parts — labor hours, material costs, subcontractor commitments, equipment charges, and change orders — spread across multiple cost codes and job sites simultaneously. Consolidating all of that manually isn't just tedious. It's structurally error-prone.
Research from Panko's field-audit studies found that the vast majority of operational spreadsheets contain errors — and construction finance teams are running some of the most complex spreadsheet models in any industry. Broken formulas, version-control failures, and manual reconciliation errors don't announce themselves; they corrupt the reports leadership relies on for project decisions.
The downstream consequences show up in budget performance. A global survey by KPMG found only 31% of projects came within 10% of their planned budget — and that figure reflects large capital projects where reporting processes should be most mature.
The Lag Problem
Even when spreadsheets are error-free, the timing problem remains. WIP reports built from manual exports typically take weeks to compile. By the time the finance team has gathered field data, reformatted columns, reconciled discrepancies, and delivered a finished report, leadership is reading numbers that describe a project from two or three weeks ago.
For a fast-moving project, that lag is the difference between catching a subcontractor overage early and discovering it after the budget is blown.
The Field-to-Office Disconnect
Lag is only half the problem. When field data arrives in inconsistent formats — labor hours logged with different codes, material usage not entered until end of week, daily progress tracked in a separate system — every upstream report inherits that inaccuracy. Budget-vs.-actual comparisons, cash flow projections, and margin estimates all reflect the same underlying mess.
The result: construction financial managers routinely spend 10–20 days per reporting cycle assembling data rather than analyzing it — leaving no time to act on what those numbers actually reveal.
What Automated Construction Budget Tracking Looks Like in Practice
The Data Pipeline, Explained Simply
Automated budget tracking means your financial data flows directly from your construction ERP — Procore, Sage, Vista, Acumatica, Foundation, or others — into a centralized reporting layer that standardizes cost codes, maps data logic, and populates dashboards without manual intervention.
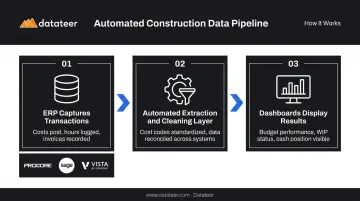
The pipeline works in three steps:
- ERP captures transactions — costs post, hours are logged, invoices are recorded in the system of record
- Automated extraction and cleaning layer — standardizes cost codes, catches malformed entries, reconciles data across systems (Procore commits to Sage invoices, for example) without any VLOOKUP work
- Dashboards display results — budget performance, WIP status, and cash position are visible without a single CSV export
Contrast this with the manual alternative: export files, reformat columns, rebuild pivot tables, reconcile discrepancies, and distribute a finished report — every single month.
What "Real-Time" Actually Means in Construction Finance
"Real-time" in construction finance doesn't mean to-the-second streaming updates. It means dashboards that reflect yesterday's data when you open them in the morning, rather than last month's data compiled over the past three weeks.
Datateer's standard configuration syncs ERP data overnight. Each morning, dashboards reflect the previous day's transactions. For teams currently operating on a 10–20 day WIP lag, daily refresh is a meaningful shift — not a semantic one.
A Business Analyst at Double L Management described the experience this way: "The very first time we accessed our data through a Datateer analytics dashboard, that one click replaced two weeks worth of prior work."
What Automation Doesn't Replace
Automation doesn't make project decisions. It doesn't assess risk, negotiate with subcontractors, or evaluate whether a change order is worth pursuing.
What it does is put reliable numbers in front of the people making those calls. Specifically, automation delivers:
- Accurate cost data — no manual rekeying errors or formula breaks
- Current figures — yesterday's transactions, not last month's export
- Consistent structure — cost codes and job data reconciled across systems automatically
The result: project managers and CFOs make decisions based on what's actually happening on the job, not what the spreadsheet said three weeks ago.
The Key Processes to Automate in Construction Budget Tracking
ERP Data Sync and Cost Code Standardization
Cost code standardization is the foundation everything else builds on. If labor costs are coded inconsistently across projects or divisions, every downstream report produces misleading comparisons — you can't benchmark project performance, identify problem cost centers, or trust a budget-vs.-actual summary.
Automation that standardizes cost codes at the data extraction layer solves this at the source. Instead of running monthly exports and manually normalizing data in Excel before you can even begin analysis, a direct ERP integration handles the mapping automatically. Data arrives at the dashboard layer already clean and consistently structured.
JBKnowledge's 2021 Construction Technology Report found that 49% of construction firms manually transfer data between applications and 44% use spreadsheets as the transfer method — nearly half the industry doing by hand what automation handles automatically.
WIP Report Automation
WIP is the most construction-specific and most labor-intensive report in the finance team's toolkit. It drives revenue recognition under percentage-of-completion accounting, informs bonding and surety capacity, and gives leadership the clearest picture of project health.
AICPA-CIMA guidance calls for WIP schedules to be updated monthly and cross-checked against other financial statements — which in a manual environment means significant recurring staff time.
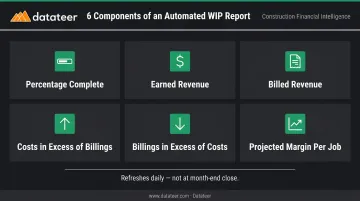
Automated WIP pulls the necessary data directly from the ERP:
- Percentage complete
- Earned revenue
- Billed revenue
- Costs in excess of billings (under-billings)
- Billings in excess of costs (over-billings)
- Projected margin per job
The result is a WIP schedule that refreshes daily rather than being compiled over weeks, and can be run mid-month to catch problems before close rather than only at period end.
Budget-vs.-Actual Dashboard Automation
Automated budget-vs.-actual dashboards compare actual costs versus budget at the job, phase, cost code, and resource type level, updating as transactions post in the ERP rather than requiring manual rebuilds.
The critical shift is where the finance manager's time goes. Instead of spending days formatting data and rebuilding variance reports, they analyze what the data reveals: which project is diverging from plan, by how much, and what corrective action is available.
At a glance, the dashboard surfaces:
- Job-level and phase-level cost variance
- Cost code anomalies flagged against budget thresholds
- Drill-down to source ERP transactions without a custom export
Datateer's Budget vs. Actuals dashboard includes drill-down to source ERP transactions, meaning a CFM can investigate a specific cost code anomaly without leaving the dashboard or requesting a custom export.
Automated Margin Fade Detection
FMI defines margin fade as a decline from original estimated gross margin to final actual margin — and it's one of the hardest problems to catch in monthly spreadsheet reviews because it happens incrementally. One FMI case example showed a project fade from 9.3% to 4.2% margin, a deterioration that compounded across months before it was visible.
Automated margin monitoring surfaces fade signals continuously rather than waiting for month-end close:
- Labor overrun by cost code and phase
- Material price escalation versus bid-estimate unit prices
- Subcontractor cost increases
- Change orders not yet approved (work performed, margin not yet recovered)
Catching these signals while the project is still in progress gives the team time to act: negotiate subcontractor scope, accelerate billing, or flag change orders before the margin loss compounds through close.
Cash Flow and Liquidity Forecasting Automation
Automated budget tracking extends naturally into forward-looking cash flow. Datateer's 13-week cash flow forecasting uses committed costs, billing schedules, and project progress data already in the ERP to generate projections that update daily rather than requiring a manually maintained Excel model.
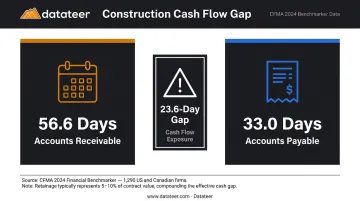
CFMA's 2024 Financial Benchmarker reports average accounts receivable of 56.6 days against average accounts payable of 33.0 days across 1,290 US and Canadian construction firms. That structural gap makes liquidity forecasting essential, not optional.
FMI notes that retainage alone, typically 5–10% of contract value, often equals or exceeds net margins — making it one of the single largest variables in any cash position.
When cash flow projections update automatically from live project data, the finance team can anticipate liquidity gaps weeks ahead rather than discovering them at the bank.
Choosing the Right Construction Budget Automation Solution
Not all budget automation tools are built for construction. Here are the criteria that separate solutions designed for the industry from generic BI tools retrofitted to it.
Does It Connect to Your ERP Without Manual Steps?
The solution must integrate natively with the ERP already in use. Any requirement for parallel data entry or a manual export step before data flows into reports is a red flag. Key systems to verify:
- Procore, Sage 100, Sage 300, Sage Intacct
- Viewpoint Vista, Viewpoint Spectrum
- Acumatica Construction, Foundation Software
- CMiC, Jonas Construction, QuickBooks, NetSuite
Solutions with pre-built connectors for 20+ systems reduce implementation risk compared to custom-built integrations that require IT involvement for each connection.
Does It Handle Data Cleaning Automatically?
Ask whether the solution handles cost code mapping and data cleaning automatically, or whether the finance team must normalize data before it flows into reports. The best solutions perform expert data extraction and cleaning upstream — before dashboards are populated — eliminating the most common source of reporting errors.
Does It Include Construction Dashboards on Day One?
A generic BI tool can connect to a construction ERP. Building a compliant WIP schedule, a meaningful margin analysis, or a useful labor cost report from scratch, however, requires construction-specific data models that most horizontal BI tools don't include.
Look for solutions that deliver construction dashboards on day one, with zero internal configuration required. The core reports that matter most:
- WIP schedule and over/under-billings
- Budget-vs.-actual by job and cost code
- Cash flow and 13-week liquidity forecasting
- Labor productivity and crew performance
- Margin protection and fade alerts
- Project manager scorecards
Pricing Structure and Scalability
Module-based pricing makes total cost unpredictable as reporting needs grow. A flat annual fee per data source with unlimited users ensures the finance team can expand dashboard access to project managers and executives without cost penalties.
Datateer operates on this model: flat annual pricing starting at $10,000 per data source, unlimited users, and all 12 dashboards included from day one with a 2–4 week setup. The annual fee starts only after data is flowing, not at contract signing.
Best Practices for Implementing Automated Budget Tracking
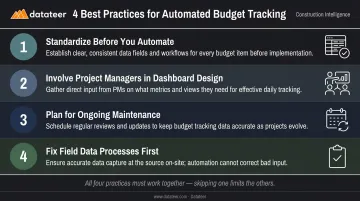
Getting automated budget tracking right comes down to four interconnected practices. Two are about data quality; two are about the people and processes that data serves. Skipping any one of them limits what the other three can deliver.
Standardize before you automate. If cost codes or chart-of-accounts structures vary across projects or divisions, address that inconsistency before the integration goes live. Automation scales whatever is in the data — clean inputs produce clean dashboards, messy inputs produce misleading ones. Datateer's automated data cleaning standardizes cost codes on ingestion, but the underlying ERP data quality still sets the ceiling on what any tool can produce.
Involve project managers in dashboard design. Finance teams use dashboards to report; PMs use them to make daily decisions. The two groups need different views of the same data. Dashboards built without PM input tend to track the wrong metrics — or present numbers in formats field leaders won't open twice. Get PM feedback before rollout, not after.
These first two practices set up the system correctly. The next two keep it running correctly.
Plan for ongoing maintenance. Automated budget tracking isn't a one-time setup. As ERP configurations change, cost codes evolve, and new projects are added, data mappings need to stay current. A quarterly review — even a short one — is enough to catch drift before it produces stale or misleading dashboards.
Don't expect automation to fix bad field processes. If labor hours are logged inconsistently, or POs post weeks late in the ERP, automated dashboards will reflect those gaps — accurately. Automation makes data quality problems more visible, not invisible. Before going live, audit two or three recurring field workflows:
- Are labor hours logged same-day or batched weekly?
- Do PO approvals post within 48 hours of commitment?
- Are subcontractor invoices coded to the correct cost phase?
Fixing those upstream habits is what determines whether the dashboards your team sees are decision-ready or just faster versions of the same unreliable numbers.
Frequently Asked Questions
How do you track a construction budget effectively?
Establish a baseline budget by cost code, connect your ERP to a reporting layer that pulls actuals daily, and monitor budget-vs.-actual dashboards consistently. Use automated alerts to flag deviations before they become overruns rather than discovering them at month-end close.
What are the most common causes of construction budget overruns?
Scope creep, delayed labor and material cost visibility, inaccurate WIP reporting, and change orders that aren't tracked or billed in time. All of these problems are compounded by manual tracking systems that surface them weeks after they started.
How does automated budget tracking differ from using Excel?
Excel requires manual data exports, reformatting, and formula maintenance every reporting cycle. Automated systems pull ERP data directly into pre-built dashboards that refresh daily — eliminating lag, reducing errors, and freeing finance teams from repetitive data assembly work.
Which construction ERPs does budget tracking software typically integrate with?
Common integrations include Procore, Sage 100, Sage 300, Sage Intacct, Viewpoint Vista, Viewpoint Spectrum, Acumatica Construction, Foundation Software, CMiC, Jonas Construction, QuickBooks, and NetSuite. Solutions with pre-built connectors for 20+ systems reduce implementation risk and avoid custom IT work.
How long does it take to implement automated construction budget tracking?
Most implementations take 2–4 weeks for a standard ERP connection, with dashboards available on day one. Datateer, for example, starts the annual subscription fee only when data is flowing — not at contract signing.
What reports should automated construction budget tracking generate?
Core reports include WIP schedule, budget-vs.-actual by cost code and job, cost-to-complete, labor cost analysis, 13-week cash flow forecast, and margin analysis by project. Purpose-built solutions like Datateer deliver all of these as standard dashboards without requiring internal configuration.