Introduction
Most construction firms track the wrong KPIs — or rather, they track them at the wrong time.
Cost at completion, schedule variance, earned value — these are all useful numbers. But by the time they show a problem, the problem is already weeks old. Crews have sat idle, materials never arrived, and a trade handed off incomplete work to the next crew who discovered the defects on day one of their scheduled start.
Research from PlanGrid and FMI found that non-optimal activities — fixing mistakes, searching for project data, resolving conflicts — cost U.S. construction $177.5 billion annually in labor. Team members lose an average of 14 hours per week to these issues — a workflow breakdown that only shows up as a financial problem after it's too late to fix.
This article covers the three lean construction KPI categories that govern workflow health before the money moves: buffers, roadblocks, and handoffs. Each one is a leading indicator. Together, they tell you where your project is headed — not where it's been.
Key Takeaways
- Buffer KPIs measure how fast schedule and resource cushion is consumed; a spike predicts crew idle time and cost overrun ahead of time
- Roadblock KPIs (led by Percent Plan Complete) track why work stops and whether constraint resolution is keeping pace
- Handoff KPIs measure how reliably work transfers between trades — the highest-risk moment in any workflow
- These three categories are leading indicators; traditional cost and schedule metrics are lagging. The gap between them is where margin disappears.
- Lean workflow KPIs only become financially actionable when connected to cost-to-complete and labor data in real time
What Are Lean Construction KPIs — and Why These Three Categories Matter
Traditional construction KPIs report outcomes. Budget variance tells you what happened. Schedule delay tells you what already slipped. These numbers matter, but they arrive after the fact, often weeks after the field condition that caused them.
Lean construction KPIs work differently. They measure what is happening inside the production system right now, while there is still time to intervene.
The Last Planner System as the Source
The Lean Construction Institute describes the Last Planner System as a planning and production-control system focused on generating and maintaining flow through conversations among project participants. It operates across five connected planning horizons: Milestone Planning, Phase Pull Planning, Look Ahead Planning, Weekly Work Planning, and Learning/Improving.
Each planning conversation generates measurable data. That data — who committed to what, what was actually completed, what prevented completion — is the raw material for lean workflow KPIs.
Why Buffers, Roadblocks, and Handoffs
These three categories cover the full workflow picture:
- Buffers are deliberate reserves — time, resources, materials — built into the plan to absorb variability. Buffer KPIs measure whether those reserves are being consumed faster than the project can tolerate.
- Roadblocks are unplanned conditions that prevent committed work from happening. Roadblock KPIs track frequency, type, and resolution speed.
- Handoffs are transfer points between trades, crews, or phases. Handoff KPIs measure whether work is ready to transfer when it's supposed to.
Together, these three categories describe workflow health days or weeks before financial metrics reflect it.
Buffer KPIs: Measuring the Cushion That Protects Project Flow
A buffer in lean construction is any deliberately planned reserve intended to absorb variability. A 2024 Lean Construction Journal systematic review identifies four main types: time float, material inventories, budget contingencies, and excess equipment capacity.
The research also flags a trap: oversized buffers become waste. Inefficient sizing can add unnecessary time and still fail to protect the schedule. The goal is right-sized buffers with active monitoring — not padding that everyone ignores.
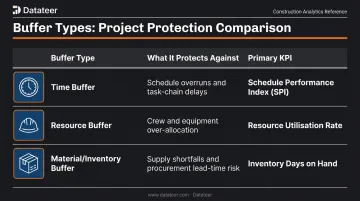
The Three Buffer Types and Their KPIs
| Buffer Type | What It Protects Against | Primary KPI |
|---|---|---|
| Time buffer | Phase-to-phase schedule slippage | Planned float vs. actual remaining float |
| Resource buffer | Crew/equipment unavailability | Reserved capacity utilization rate |
| Material/inventory buffer | Procurement delays causing stoppage | Lead time variance + on-site coverage days |
Buffer Consumption Rate is the core metric across all three types. It calculates the ratio of buffer consumed to total buffer planned at a given milestone. The key is tracking this as a trend line, not a point-in-time number. A project consuming 20% of its time buffer by week 4 of a 20-week phase is in a very different position than one consuming 60% by week 8 — even if the raw percentages look comparable in isolation.
Material Buffer KPIs in Practice
Lead time variance — the gap between actual material delivery time and planned lead time — is one of the clearest early warning signals available to a project team. When lead times start running longer than planned, crew downtime follows.
LCI's standard Reasons for Variance taxonomy lists "Materials not Available" as a primary constraint category, and Glenn Ballard's foundational 1994 research on union electricians identified materials and prerequisite work as frequent obstacles to completing planned tasks.
That research context points directly to a practical tracking pair: on-site inventory coverage days alongside lead time variance. When coverage days drop while lead times rise simultaneously, a stoppage is likely unless procurement accelerates.
Buffer Triggers
Passive buffer tracking is not enough. Teams should pre-define threshold values that trigger action:
- Define escalation thresholds before the project starts (example: if time buffer consumption exceeds 40% at the one-third project milestone, a recovery plan is activated)
- Assign ownership for each buffer type — someone must be responsible for calling the trigger
- Review buffer status weekly in Look Ahead Planning sessions, not monthly
Without pre-defined triggers, buffer data sits in a report no one acts on — which is the same outcome as having no buffer at all.
Roadblock KPIs: Tracking Constraints Before They Derail Work
In the Last Planner System, a roadblock — also called a constraint — is any condition that prevents a planned task from being completed as scheduled. The key distinction from traditional construction: every missed commitment must be logged with a specific reason category. No vague "scope issues" or "field conditions" — the reason is categorized, tracked, and analyzed.
Percent Plan Complete: The Foundational Metric
PPC measures the percentage of planned tasks actually completed in a given week. It was defined by Glenn Ballard in 1994 as completed planned activities divided by total planned activities.
LCI reports that, on average, only 54% of work planned for a week is completed as planned — a useful baseline, though not a universal benchmark. Ballard and Tommelein also caution that PPC can reach 100% while a project still misses milestones, so PPC should never be the only measure of plan health.
PPC's real value is as a constraint trigger. When PPC drops, the question isn't "how low is it?" — it's "what's causing it?"
Constraint Categorization: Where PPC Becomes Actionable
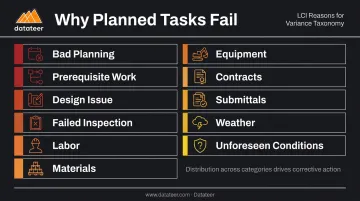
LCI publishes a standard Reasons for Variance taxonomy that categorizes why planned tasks weren't completed:
- Bad planning
- Prerequisite work not complete
- Design issue / drawing not approved
- Failed inspection
- Labor not available
- Materials not available
- Equipment not available
- Contracts / change orders / FCO's
- Submittals
- Weather
- Unforeseen conditions
Knowing the distribution of these constraint types is what points toward specific corrective action. A project where 60% of RPNCs are "Design Issue / Drawing Not Approved" needs a design communication fix, not a procurement solution.
Constraint Resolution Cycle Time
Constraint Resolution Cycle Time is the average number of days from when a constraint is logged to when it's cleared. Track it weekly.
Watch for two warning signals:
- Cycle time rising week-over-week (make-ready process is slowing)
- Cycle time consistently above 5-7 days (constraints aren't being resolved before they block work)
A rising cycle time means constraints are being identified but not cleared in time to protect the plan.
Constraint Recurrence Rate
When the same constraint type appears across multiple consecutive weeks, it's not a one-off. It's a systemic failure. LCI explicitly states that variance categories help teams "identify areas of recurring failure that require reflection and analysis."
A practical example: if "Drawing Not Approved" appears in weeks 3, 4, 5, and 6, the issue isn't a slow approver on one drawing. It's a structural breakdown in the design communication workflow that requires root cause analysis and a process change — not another email to the architect.
Handoff KPIs: Measuring the Moment Work Transfers Between Teams
Handoffs are the highest-risk moments in construction workflow. LCI defines focus on flow as "smooth, unimpeded handoffs among project team members from one crew to the next." When prerequisites aren't met, the receiving trade arrives to a situation they can't work in — and the schedule, budget, or both absorb the cost.
LCI's hand-off work planning framework identifies clear near-term milestones, individual commitments, and short commitment durations (approximately five days maximum) as the core practices that improve near-term work-plan reliability at transfer points.
Handoff Readiness Rate
This is the percentage of scheduled handoffs where all defined prerequisites were confirmed ready before the handoff date. Prerequisites typically include:
- Space available and clear
- Prior work complete and accepted
- Materials on site for the receiving crew
- Approved drawings in hand
- Any required inspections passed
Handoff Readiness Rate is tracked through make-ready planning sessions — the weekly conversations where the Last Planner team looks ahead 3-6 weeks and systematically removes constraints before they become handoff failures.
Handoff Delay Frequency
Track how often handoffs are delayed (as a percentage of total scheduled handoffs) and the average delay duration in days. The more useful cut of this data is by trade pair — mechanical-to-electrical, concrete-to-steel, rough-in-to-drywall.
Trade-pair analysis reveals which specific workflow transitions are chronic problems versus one-time events. A pattern of mechanical-to-electrical delays on multiple floors or phases points to a sequencing or scope coordination failure that can be addressed directly.
Handoff Quality Rate
The percentage of handoffs where the receiving trade identifies defects or incomplete work at the point of transfer. This KPI sits at the intersection of lean workflow and quality management.
A rising Handoff Quality Rate compounds quickly: the receiving trade loses productive time at the start of their phase, rework pulls resources from forward progress, and schedule compression forces premium overtime to recover.
PlanGrid and FMI put U.S. construction rework costs at more than $31 billion annually, driven by miscommunication and inaccessible information — two problems that poor handoff quality directly feeds.
Connecting Lean Workflow KPIs to Financial Outcomes
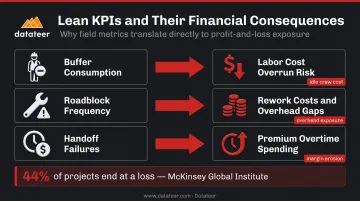
The financial translation of each KPI category is direct:
- Buffer consumption → labor cost overrun risk (crews waiting = hours billed, zero output)
- Roadblock frequency → rework costs and overhead absorption gaps
- Handoff failures → schedule compression that forces premium overtime spending
McKinsey's 2024 construction productivity analysis reports that 44% of 2,700 benchmarked projects ended at a financial loss. Global construction labor productivity grew just 0.4% annually from 2000 to 2022 — compared to 90% growth in manufacturing over the same period. The gap between where productivity is and where it should be isn't a skills problem. It's a workflow measurement problem.
The Field-Office Data Gap
Lean workflow KPIs — PPC scores, constraint logs, buffer consumption, handoff readiness — are typically tracked on whiteboards, sticky notes, or field spreadsheets. They rarely reach the finance team.
By the time a buffer consumption spike or a persistent "materials not available" constraint pattern shows up in the monthly cost report, the damage is done. The crews already waited, the overtime was already paid, and the margin already faded.
This is why construction firms lose margin they never see coming — not because the signals weren't there, but because the signals were trapped in the field.
Closing the Gap with Connected Analytics
The fix is connecting field-sourced operational data to financial outcome metrics in the same reporting environment — not adding more standalone dashboards.
Datateer's construction analytics platform syncs overnight from major construction ERPs — Procore, Sage, Viewpoint Vista, Acumatica, Foundation, CMiC, and others — and supports CSV uploads so manually tracked field data, including lean workflow metrics, merges with automated ERP feeds in the same dashboards.
That means buffer consumption data and constraint logs sit alongside the Job Costing & Cost-to-Complete module's labor cost-to-complete projections and the Margin Protection analytics that flag negative variance drivers in real time. Finance teams can act on workflow signals before the monthly close cycle. The Project Excellence & Field Operations suite is built specifically to surface problem jobs before they escalate, shifting the role from forensic accounting to forward-looking intervention.
Moving from a 10-20 day WIP reporting lag to overnight automated refresh is the practical difference between catching a workflow breakdown in time to respond and finding out about it in the next job cost report.
Frequently Asked Questions
What are the key performance indicators (KPIs) for lean construction?
The most critical lean-specific KPIs are leading process indicators: Percent Plan Complete, constraint categorization logs, buffer consumption rate, and handoff readiness rate. These measure workflow health in real time — predicting schedule and cost outcomes before they surface in financial reports.
What is a KPI in lean construction?
A lean construction KPI is a measurable process indicator that tracks workflow health and identifies waste in real time. Traditional construction metrics report outcomes after the fact. Lean KPIs measure what's happening inside the production system while there's still time to intervene.
What are the 4 P's of KPIs in lean construction?
The 4 P's framework — People, Processes, Product, and Progress — organizes lean KPIs into four measurable categories. Buffer, roadblock, and handoff KPIs fall primarily within Processes and Progress, covering production system behavior and workflow advancement.
What are the 5 principles of lean construction?
LCI identifies the five lean principles as: Define Value, Identify the Value Stream, Focus on Flow, Establish Pull, and Pursue Perfection. Buffer, roadblock, and handoff KPIs are direct operational measures of the "Focus on Flow" and "Pursue Perfection" principles applied at the project level.
How do you measure handoff efficiency in lean construction?
Two metrics cover this: Handoff Readiness Rate measures the percentage of scheduled handoffs where all prerequisites were confirmed before the transfer date. Handoff Delay Frequency tracks how often handoffs slip and by how many days. Both are captured through weekly make-ready planning sessions.
What is the difference between a buffer and a constraint in lean construction?
A buffer is a deliberately planned reserve of time, resource, or material built into the schedule to absorb variability. A constraint is an unplanned condition that blocks work from proceeding. Buffers are proactive — built before work starts. Constraints are reactive signals that the production system has already broken down.