Introduction
Most construction CFOs and finance managers can't answer a simple question—"which projects are bleeding margin right now?"—without days of manual work. The data exists. It's just scattered across a Sage or Vista ERP, Procore, a payroll system, and a dozen spreadsheets that no one fully trusts.
The result is a 10–20 day WIP reporting cycle where financial decisions get made on stale numbers. By the time the spreadsheet is finalized, margin fade has already set in. A cost overrun that could have been caught in week two has compounded into a six-figure loss.
This guide breaks down what construction data integration actually is, why fragmented data is a direct financial liability, how integration works in practice, and what it makes possible—faster closes, real-time margin visibility, and finance teams that spend less time gathering data and more time acting on it.
TL;DR: Key Takeaways
- Construction data integration connects ERPs, field tools, payroll, and documents into a single source of truth, ending the need for manual data gathering across systems
- Fragmented data creates real financial risk: missed billing windows, undetected cost overruns, and margin fade that compounds before anyone sees the numbers
- Integration involves extraction, standardization, and delivery. Each step's quality directly determines whether your dashboards can be trusted
- Real-time WIP, job costing, and cash flow visibility only become possible when financial data flows automatically from ERP to analytics layer
- Finance teams that integrate their data stop chasing numbers and start driving decisions before problems become losses
What Is Construction Data Integration?
Construction data integration is the process of connecting information from multiple, disconnected systems—ERP platforms, project management tools, payroll systems, and unstructured documents—into a single, consistent, analysis-ready environment. The goal is data that's ready to use: clean, current, and connected across every job and system your firm runs.
The Main Integration Approaches
| Approach | How It Works | Best For |
|---|---|---|
| Batch/ETL | Scheduled exports at set intervals | Regular reporting cycles |
| Real-time API sync | Continuous live connections between systems | Active project monitoring |
| File-based transfers | CSV or Excel exports moved between systems | Legacy systems without APIs |
| Data warehouse consolidation | Cleaned data centralized for analysis | Enterprise analytics environments |
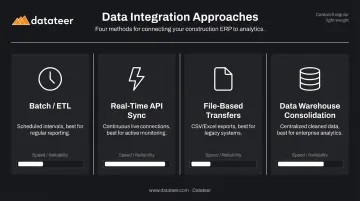
Direct API connections deliver the most current data. File-based transfers introduce manual steps and version-control gaps — problems that compound quickly when you're managing active jobs across multiple systems.
Why Construction Is Uniquely Complex
Construction creates a data fragmentation problem that most other industries don't face:
- Cost code structures differ across every job, making cross-project comparisons unreliable by default
- GCs, subs, and owners each run different systems that were never built to share data with each other
- Financial data lives in two separate places: back-office ERPs and field-facing project tools — rarely in sync
A manufacturing company has one factory, one set of costs, one accounting view. A construction firm running 40 active projects across multiple GC relationships is managing 40 separate financial universes simultaneously. Without integration, that complexity produces reporting delays, cost blind spots, and decisions made on data that's already weeks out of date.
Why Fragmented Construction Data Costs More Than You Think
The Excel Trap
Most construction finance teams still rely on spreadsheets to consolidate WIP, job cost, and billing data. This isn't a bad habit—it's the only option when systems don't talk to each other.
The problem is the process it creates: data pulled manually from multiple systems, reformatted, checked for errors, reconciled, and then shared—two to three weeks after the reporting period ended. According to PlanGrid and FMI research, inaccurate and inaccessible project data drives 48% of US construction rework, costing more than $31.3 billion annually. The same study found construction professionals spend 35% of their time on non-optimal activities—searching for data, resolving conflicts, and cleaning up mistakes.
That's 14 hours a week per person not spent on work that moves projects forward.
The Margin Fade Problem
By the time a WIP report is finalized using manual processes, the project conditions it describes have already changed. Cost overruns that were fixable early have already compounded before anyone sees the numbers.
This reactive cycle is the core financial risk of fragmented data. Finance teams aren't under-performing—they're working with information that arrives too late to act on.
The Field-Office Gap
That late-data problem has a structural cause: field and office systems don't share information. Here's how the disconnect typically plays out:
- Field teams log daily progress and labor hours in Procore
- Accounting tracks costs and commitments in Sage or Vista
- Payroll runs in a separate HR system
- No single person has a complete picture of project health
Reconciling these three data streams requires manual effort, introduces human error, and creates the "field-vs-office finger-pointing" dynamic that wastes time on data disputes instead of fixing actual problems.
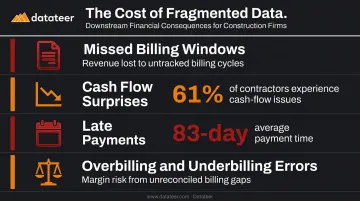
The Downstream Financial Consequences
Fragmented data doesn't just slow reporting. It creates concrete financial risk:
- Missed billing windows when progress data and AR data don't connect
- Cash flow surprises from inability to forecast liquidity across active jobs
- Late payments that compound the damage—Levelset's survey of 503 construction professionals found 61% of contractors experience cash-flow issues, with average payment time hitting 83 days
- Overbilling and underbilling errors when WIP calculations are done manually with incomplete data
Construction operates on thin margins. Decisions made with stale data—on change orders, resource allocation, or cash draws—compound quickly. The cost of fragmented data ultimately shows up as eroded profit margins.
The Construction Data Ecosystem: Key Sources to Connect
Construction data doesn't live in one place. Financial records, field activity, labor costs, and documents each sit in separate systems — and the integration challenge is connecting them without losing accuracy or context. Here are the four key sources most construction firms need to unify.
ERPs: The Financial Backbone
Systems like Sage 300, Vista by Viewpoint, Acumatica, and Foundation Software hold job cost data, the general ledger, AP/AR, and often payroll. The ERP is the system of record for most construction firms—but it's typically locked away from executives and field teams without a direct integration layer.
These systems also vary significantly in how they structure cost codes and project data, which creates standardization challenges when connecting multiple ERPs or when field data needs to align with ERP accounting.
Project Management and Field Tools: The Operational Layer
Platforms like Procore capture daily logs, RFIs, change orders, subcontractor performance, and schedule updates. Without integration, that activity data never connects with financial data in the ERP — making it impossible to correlate labor productivity with actual cost performance, or to see whether field progress matches what's being billed.
Payroll and Labor Cost Data
Field data gaps compound quickly when labor costs aren't tracked in the same system. Labor is typically the largest variable cost on a project, and when payroll is disconnected from project cost tracking, finance teams lose visibility into:
- Hours logged per cost code
- Labor productivity against budget
- Real-time labor cost-to-complete
Without this connection — whether labor flows from a standalone payroll system or from modules within the ERP — job costing and WIP calculations remain permanently incomplete.
Unstructured Data Sources
Subcontractor invoices, pay applications, lien waivers, and change orders often live as PDFs, scanned documents, or multi-tab Excel workbooks. These contain critical financial information but require additional processing to become usable in an integrated system. CSV uploads can bridge this gap for data that isn't available through direct ERP connections.
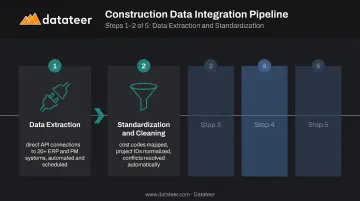
How Construction Data Integration Works
A well-built integration pipeline follows five steps. The reliability of each step determines the quality of everything downstream.
Step 1 — Data Extraction
Data is pulled from source systems through direct API connections or native ERP connectors. This enables automated, scheduled extraction without manual exports. The alternative—CSV exports and FTP transfers—introduces delays and requires human intervention.
Datateer's platform uses zero-lift direct connections to 20+ construction ERP and project management systems, including Procore, Sage 100/300/Intacct, Viewpoint Vista, Viewpoint Spectrum, Acumatica Construction, Foundation Software, CMiC, Jonas Construction, QuickBooks, and NetSuite.
Step 2 — Standardization and Cleaning
Cost codes differ between ERP systems. Job numbers are formatted inconsistently. Vendor names appear under multiple variations — and these discrepancies are often the biggest obstacle to reliable reporting.
A well-designed integration pipeline maps and standardizes incoming data, aligning cost codes, normalizing project identifiers, and handling null or conflicting values before any analysis runs. Datateer's automated standardization engine handles this automatically, including reconciling Procore project commits against Sage invoices without manual VLOOKUP work.
Step 3 — Centralized Data Layer
Cleaned, standardized data loads into a centralized analytics environment — a data warehouse or purpose-built construction analytics platform. This becomes the single source of truth that all reports, dashboards, and KPIs draw from, eliminating the version control issues that make spreadsheet-based reporting unreliable.
Step 4 — Dashboard and Report Delivery
With a centralized data layer in place, integrated data surfaces to end users through dashboards covering WIP, job cost, cash flow, subcontractor performance, and earned value. Datateer's platform delivers 12 pre-built dashboards across four strategic suites on day one, with data refreshed automatically — replacing weeks of manual spreadsheet work.
Key delivery details:
- Setup time: 2–4 weeks, with data flowing before annual fees begin
- Pricing: Flat annual rate starting at $10,000 per data source
- Users: Unlimited, with no per-seat fees
Step 5 — Governance and Access Control
Integrated data environments need role-based access controls so field teams, project managers, finance staff, and executives each see the data relevant to their role. Governance policies (defining who can view, edit, or export data) should be established before integration is built, not retrofitted afterward. Clients maintain full ownership of their data throughout.
What Integrated Data Makes Possible for Construction Finance Teams
Real-Time WIP and Job Cost Visibility
With integrated data, finance managers can see current cost-to-complete, percent-complete, and overbilled/underbilled status across every active project without running a single manual report. Datateer's WIP and job costing dashboards surface actual costs incurred, committed costs, pending change orders, projected final cost, and variance to budget at the job, phase, and cost-code level.
One client, Double L Management, captured this shift directly: "The very first time we accessed our data through a Datateer analytics dashboard, that one click replaced two weeks worth of prior work."
Monthly close shifts from a weeks-long ordeal to a continuous process. Margin issues get caught while there's still time to act.
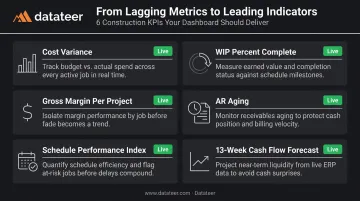
Construction KPIs That Become Leading Indicators
Without integration, most firms calculate these KPIs retrospectively. With integration, they become active signals:
- Cost variance (budgeted vs. actual by job and cost code)
- WIP percent complete (earned vs. billed)
- Gross margin per project (real-time, not end-of-job)
- Accounts receivable aging (cash flow visibility across all jobs)
- Schedule Performance Index (earned value vs. planned value)
- 13-week cash flow forecast (projected bank balance based on live burn rates and retainage schedules)
The Strategic Shift for Finance Professionals
The biggest change integration enables is a fundamentally different job description for finance.
Finance teams that integrate their data stop spending most of their time gathering and formatting numbers. CFOs and controllers move out of "forensic accounting" — reconstructing what went wrong after the fact — and into strategic partnership: identifying risks and opportunities before they hit the bottom line.
Datateer's Excel Tax Calculator quantifies this directly. A team spending 40 hours per month on manual reporting with two staff members at an average hourly rate carries an annual Excel Tax of approximately $43,846 in labor cost alone.
Common Challenges—and How to Overcome Them
Non-Standardized Data Across Systems
Inconsistent cost codes, project naming conventions, and data formats between ERPs and field tools are the most common technical barrier to integration. The solution is a dedicated data mapping and standardization layer that normalizes incoming data before it reaches the analytics environment.
This is why generic BI tools often fail construction firms: they surface raw data as-is rather than applying construction-specific logic. A platform built for construction comes with pre-mapped cost codes, ERP-specific field logic, and standardized job costing structures already in place.
Resistance to Change
Teams accustomed to their own spreadsheet processes may resist new systems if they feel they're losing control of their data. The most effective counter is a quick, concrete win.
JBKnowledge's construction technology research found that when apps don't integrate:
- 49% of firms manually transfer data between systems
- 44% fall back on spreadsheets as the workaround
Most teams already feel how painful the current state is. Showing a WIP report that previously took two weeks now refreshing automatically is more persuasive than any change management presentation.
Data Security and Governance
Construction firms handle sensitive financial data, client information, and subcontractor contracts. Any integration architecture should include:
- Access controls that limit data visibility by role
- Encryption for data in transit and at rest
- Clear data ownership policies (clients should own their data)
- Defined retention and sharing protocols
Getting these governance decisions locked in before integration is built is far cheaper than retrofitting access controls and ownership policies after data is already flowing.
Frequently Asked Questions
What are the 5 key performance indicators in construction?
The five most critical financial KPIs are cost variance (budget vs. actual), WIP percent complete, gross margin per job, accounts receivable aging, and Schedule Performance Index. Together, they show whether a project is on track and whether the business has the liquidity to sustain it.
What are the types of data integration?
The four main types are: batch/ETL (scheduled transfers), real-time API sync (continuous live connections), file-based integration (CSV or Excel exports), and data warehouse consolidation. Direct API connections deliver the most current data; file-based approaches introduce delays and manual steps.
What is the difference between data integration and data management in construction?
Data management covers the broader set of practices for collecting, storing, securing, and governing data across its lifecycle. Data integration is the specific process of connecting multiple systems so data flows between them automatically and consistently—it's one component within the larger data management framework.
How long does it take to set up construction data integration?
Modern platforms purpose-built for construction can have data flowing within 2–4 weeks, compared to months for custom-built solutions. Datateer's setup process includes expert automated data extraction and cleaning, with the annual subscription starting only once data is actively flowing.
What construction ERP systems support data integration?
Major construction ERPs with integration support include Sage 300 CRE, Sage 100 Contractor, Sage Intacct, Vista by Viewpoint, Viewpoint Spectrum, Acumatica Construction, Foundation Software, CMiC, Jonas Construction, and Procore. Platforms with pre-built connectors for these systems eliminate custom development work and cut setup time from months to weeks.