Introduction: Why Calculating Construction Profit Is Harder Than It Looks
Most contractors have a gut sense that a job went well — or didn't. What's harder is knowing exactly how much profit you made, and where it went between bid day and final invoice.
Projects that look healthy at bid time routinely finish with thinner margins — or none at all. The reason is rarely bad luck. Profit calculation in construction is a layered process: gross vs. net profit, markup vs. margin, overhead allocation, and cost tracking against a live budget all interact in ways that a single formula can't capture.
This guide covers the key formulas, sector benchmarks, the four factors that erode margin during execution, and how to shift from after-the-fact reporting to tracking profit in real time — while there's still room to act.
Key Takeaways
- Gross profit = revenue minus direct job costs; net profit = gross profit minus overhead — they are not the same number
- A 20% markup produces a 16.7% margin, not 20% — mixing them up leads to chronic underbidding on every job you price
- Industry net margins run 4–15% by sector; top-quartile firms consistently outperform through cost discipline
- Four factors kill profit after the job starts: estimating gaps, labor inefficiency, rework, and schedule drift
- Catching margin fade mid-project gives you time to act; discovering it at closeout doesn't
Gross Profit vs. Net Profit in Construction: Know the Difference
These two numbers are not interchangeable, but many contractors treat them as if they are. That confusion is expensive.
Gross profit is revenue minus direct job costs (materials, field labor including taxes and benefits, subcontractors, equipment rental, and permits tied to a specific project). It measures project-level performance: did this job produce more revenue than it consumed in direct costs?
Net profit is what's left after subtracting indirect overhead: office rent, administrative salaries, insurance, accounting fees, company vehicles, and marketing. This is the number that reflects actual business health — the amount the company retains after paying for everything it takes to operate.
Why Contractors Conflate Them
Gross margin shows up naturally in a project estimate. Overhead only becomes visible when it's properly allocated across jobs , and many firms don't do that systematically. As a result, gross profit gets tracked closely while net profit remains murky until year-end.
That allocation gap also masks a common error: owner compensation should be treated as an overhead expense, not profit. Profit is what the business retains after paying everyone, the owner included. Omitting it inflates the apparent margin on every job.
Side-by-Side Comparison: $500K Project
| Line Item | Amount |
|---|---|
| Revenue | $500,000 |
| Direct Job Costs (labor, materials, subs, equipment) | $375,000 |
| Gross Profit | $125,000 (25%) |
| Allocated Overhead (office, admin, insurance, owner comp) | $62,500 |
| Net Profit | $62,500 (12.5%) |
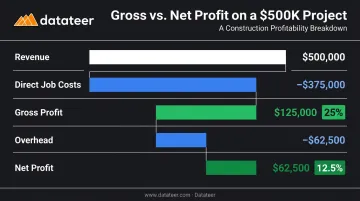
The gross margin looks healthy at 25%. The net margin , what the business actually keeps, is 12.5%. Gross profit tells you whether the job was run efficiently. Net profit tells you whether the business itself can survive.
How to Calculate Construction Project Profit: Step-by-Step
Every profit calculation starts with a complete accounting of project costs. Miss something here, and every number downstream is wrong.
Direct costs include: field labor with taxes and benefits, materials, subcontractors, equipment rental, and permits.
Indirect costs (allocated share) include: project management time, office overhead, insurance, bonding, and owner compensation.
Gross Profit Formula
Gross Profit = Revenue – Direct Job Costs
Gross Profit Margin % = (Revenue – Direct Costs) / Revenue × 100
Example: A $400K commercial project with $300K in direct costs produces $100K gross profit — a 25% gross margin.
The challenge is that indirect costs are frequently underestimated or excluded from bids entirely. Research on overhead allocation confirms that many contractors fail to allocate indirect costs or only allocate part of them — a gap that produces bids that appear profitable but deliver thin or negative net margins. Getting this right requires a deliberate overhead allocation method, not a rough estimate.
Datateer's Overhead & Burden Rate Analytics module automates this process, calculating fully-burdened labor rates by craft and monitoring overhead absorption per project directly from ERP data — so the allocation isn't a manual estimate built into the spreadsheet and forgotten.
Net Profit Formula
Net Profit = Gross Profit – Overhead & Indirect Costs
Net Profit Margin % = Net Profit / Revenue × 100
Continuing the example above: subtract $50K in allocated overhead from $100K gross profit → $50K net profit, 12.5% net margin.
This is the number that answers "how did this job actually perform for the business?"
A projection sheet is a running financial summary that tracks budget, committed costs, contingency remaining, labor/equipment variances, and projected net profit. Updating it throughout the project — not after closeout — is what lets you act on margin problems while there's still time to fix them.
Markup vs. Profit Margin: Why Confusing the Two Costs You Money
This is one of the most common and costly mistakes in construction estimating.
- Markup is calculated as a percentage of cost
- Profit margin is calculated as a percentage of revenue
Same dollars, different denominators — and they produce different percentages.
The Math
| Scenario | Cost | Markup Applied | Selling Price | Actual Margin |
|---|---|---|---|---|
| 25% markup | $80,000 | 25% | $100,000 | 20% |
| 20% markup | $80,000 | 20% | $96,000 | 16.7% |
The formulas, side by side:
- Markup % = (Revenue – Cost) / Cost × 100
- Profit Margin % = (Revenue – Cost) / Revenue × 100
If you're targeting a 20% margin but applying a 20% markup, you're actually earning 16.7%. On an $80K job, that's roughly $2,700 in missing profit per project. Across a year of volume, that gap compounds into a significant revenue shortfall — not from poor execution, but from a math error made before work begins.
Margin-to-Markup Conversion
Work backwards from your desired margin to the correct markup using this formula:
Required Markup % = Desired Margin % / (1 – Desired Margin %)
| Target Net Margin | Required Markup |
|---|---|
| 10% | 11.1% |
| 20% | 25.0% |
| 25% | 33.3% |
| 30% | 42.9% |
Estimators think in markup; owners think in margin. They're measuring the same dollars from opposite ends of the transaction. Align both roles on the same target number — and use margin as the benchmark, since it reflects what the business actually kept.
What's a Good Profit Margin for Construction Projects?
Benchmarks vary significantly by sector. Here's what CFMA and NAHB data shows for 2023–2024:
| Sector | Avg. Gross Margin | Avg. Net Margin | Best-in-Class Net |
|---|---|---|---|
| Residential single-family builders | 20.7% | 8.7% | 17.7% (top 25%) |
| Residential remodelers | 29.9% | 6.3% | — |
| Industrial & nonresidential contractors | — | 4.4% | 7.9% |
| Heavy construction | — | 8.3% | 15.1% |
| Specialty trades | 22.4% | 7.7% | 14.2% |
| All CFMA respondents | — | 6.7% | 12.0% |
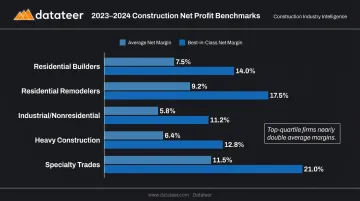
Three patterns in the data are worth flagging:
- The bottom 25% of residential builders averaged -1.4% net margin — negative profitability
- Top-quartile firms nearly double the average net margin in every category
- Best-in-class contractors reach 12–15%+ through tighter estimating and disciplined cost tracking, not higher bid prices
The numbers above are a reference point, not a target. A specialty subcontractor should aim higher than a large GC competing on thin public bids. Your overhead structure, geography, and trade all affect what's realistic. The more useful habit is comparing your current margins to your own historical performance — not just the industry average.
The Four Factors That Kill Construction Profit After the Job Starts
Profit can be well-protected at bid time and still disappear during execution. Four causes account for most of it.
1. Estimating gaps — Missing scope, underpriced allowances, or wrong production rates. These aren't always obvious until the job is underway and the cost codes start diverging from budget.
2. Field labor inefficiency — According to FMI's 2023 Labor Productivity Study, approximately 60% of contractors reported that 11% or more of field labor costs are wasted due to inefficiency. The study also found that a 6% productivity improvement can produce a 50% average increase in profitability. Crew-level inefficiency is often invisible until it's already locked in.
3. Rework and quality failures — Poor data and miscommunication account for 48% of rework in U.S. construction, equivalent to $31.3 billion annually. Schedule pressure amplifies rework: when crews rush, mistakes increase.
4. Schedule drift — Lost days compound fast. Extended general conditions, home office overhead, and liquidated damages all increase. When you spend contingency covering overhead rather than actual risk, the buffer is gone before the real problems appear.
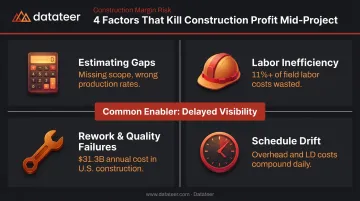
The Common Enabler: Delayed Visibility
When a PM only sees updated cost reports once a month — or two weeks after month-end — the margin fade is already locked in. Forensic accounting after the fact is not the same as catching the problem while there's still time to adjust crew deployment, issue a change order, or accelerate a critical path activity.
A weekly or biweekly review of projected net profit against budget — with a clear threshold for when variance triggers action — is the minimum needed to stay ahead.
How to Track and Protect Project Profit in Real Time
The goal isn't to calculate what you earned at closeout. It's to track what you're trending toward while you can still change the outcome.
That requires connecting estimating data, job cost actuals, and overhead allocations into a single live view — not a spreadsheet assembled manually two weeks after month-end. Construction firms commonly experience a 10–20 day lag between month-end and when WIP and profit reports are ready. By the time the data is visible, the opportunity to act has often passed.
What Effective Real-Time Profit Tracking Looks Like
A working system surfaces:
- Estimated vs. actual costs by cost code
- Committed costs (POs, subcontracts) alongside actuals
- Earned value metrics (CPI, SPI) on GMP and cost-plus contracts
- Projected final margin with variance flags
- Over/under-billing position updated continuously
This is a live view — updated as transactions post in the ERP, not assembled once a month after the damage is done.
How Datateer Closes the Gap
Datateer integrates directly with 12+ construction ERPs — Procore, Sage 100/300/Intacct, Viewpoint Vista and Spectrum, Acumatica Construction, Foundation Software, CMiC, Jonas, QuickBooks, NetSuite, and others — and delivers construction-specific financial dashboards with overnight data refresh rather than a two-week manual process.
Relevant modules include:
- Job Costing & Cost-to-Complete — actual costs, committed costs, projected final cost, and variance to budget at job, phase, and cost-code level
- Margin Protection & Margin Fade Prevention — monitors original estimated margin vs. current projected margin, flags labor overruns, material price escalation, subcontractor cost increases, and change order denial
- WIP Reporting — automated percentage complete, earned revenue, over/under-billings, and projected margin per job with real-time margin fade flagging
- Cost Variance Reporting — budget vs. actual at every level, with drill-down to source transactions
Flat annual pricing starts at $10,000/year per data source with unlimited users — no per-seat or per-dashboard fees. Implementation takes 2–4 weeks, and the annual fee doesn't start until data is flowing.
One Double L Management analyst summarized it: "That one click replaced two weeks worth of prior work."
When the data is already there — current, clean, and drilled to cost-code level — finance teams spend less time building reports and more time acting on what they show.
Frequently Asked Questions
What is a good profit margin for a construction project?
Net profit margins typically run 4–15% depending on sector. Residential builders average around 8.7% net; heavy construction averages 8.3%; specialty trades average 7.7%. Top-performing firms reach 12–15%+ through disciplined cost tracking and tighter estimating — pricing discipline is only part of the equation.
What is the difference between gross profit and net profit in construction?
Gross profit subtracts only direct job costs (labor, materials, subs, equipment) from revenue. Net profit also subtracts overhead and indirect costs like office rent, admin salaries, and insurance. Net profit is what the business actually keeps. Gross profit measures project-level efficiency; net profit measures business health.
What is the difference between markup and profit margin in construction?
Markup is calculated as a percentage of cost; margin is calculated as a percentage of revenue. A 20% markup produces a 16.7% margin — not 20%. Using markup when you mean margin results in systematically underpriced bids and smaller returns than expected.
How do I calculate profit margin on a construction project?
Use this formula: (Revenue – Total Project Costs) / Revenue × 100. Total costs must include direct costs plus an allocated share of indirect overhead — omitting overhead overstates the margin and skews both project-level and company-level reporting.
What are the most common reasons construction projects lose profit?
Four main causes: estimating gaps, field labor inefficiency, rework, and schedule drift. Delayed visibility is the common enabler. When cost data arrives two weeks late, all four factors have already compounded with no time left to course-correct.
How often should you review profit on a construction project?
Weekly or biweekly during execution. Monthly reviews leave too wide a window for problems to compound. The longer the lag between cost actuals and your reporting view, the less actionable the data. At that point, you're reading a forensic record, not managing a live project.