Introduction
Construction generates nearly $1.7 trillion in annual gross output in the U.S. — yet the average general contractor nets somewhere between 4% and 7% of every dollar billed. In a low-margin, high-stakes business, a few percentage points of miscalculation separates a profitable year from a break-even one.
In 2025, that math has gotten harder. According to Deloitte's 2026 Engineering and Construction Industry Outlook, the headwinds are stacking up:
- Construction wages rose 4.2% year over year as of August 2025
- Total construction spending fell nearly 3% year over year by July 2025
- The effective tariff rate on construction goods hit a 40-year high of 25–30%
- Project abandonment activity surged 88.2% year over year in August 2025 alone
This guide covers what contractors need to know about margins in 2025: definitions, sector benchmarks, how to calculate your numbers correctly, and the strategies that protect margin before it disappears.
Key Takeaways
- Gross profit margins for general contractors typically run 15–25%; net margins average 4–8%, with Best-in-Class firms hitting 10–12%
- CFMA data shows specialty trades averaged 22.4% gross margin and 7.7% net in 2024 — outperforming industrial/nonresidential contractors at 4.4% net
- The three root causes of margin problems: inaccurate cost estimation, overhead misallocation, and discovering overruns too late to fix
- Real-time financial visibility is what separates contractors who protect margins from those who lose them to end-of-month reports
Gross Profit, Net Profit, and Markup: Getting the Definitions Right
Direct Costs vs. Overhead
Before you can calculate margins accurately, you need a clean split between two cost categories:
Direct costs (COGS) are project-specific expenses that exist only because the job exists:
- Field labor and subcontractors
- Materials and equipment
- Permits and project-specific insurance
- Equipment rental directly tied to the job
Overhead covers the cost of running the business regardless of project activity:
- Office rent and administrative salaries
- Software subscriptions and marketing
- General insurance not tied to a specific job
This distinction determines whether a cost affects gross margin or net margin. Contractors who blur the line between the two will systematically overstate their project profitability.
The Two Margin Formulas
Gross Profit Margin shows whether your pricing covers execution costs:
Gross Profit Margin = (Revenue – COGS) / Revenue × 100
Net Profit Margin shows what the business actually keeps:
Net Profit Margin = (Revenue – COGS – Overhead) / Revenue × 100
A contractor with strong gross margins but bloated overhead can still end up with a thin or negative net. When gross and net diverge significantly, overhead is usually the culprit — and it's worth isolating exactly which line items are eating the spread.
Markup Is Not Margin
This confusion causes systematic underbidding. Here's the clearest way to see the difference:
- A job costs $10,000 in direct costs
- You apply a 25% markup: $10,000 × 1.25 = $12,500 bid price
- Your actual margin: ($12,500 – $10,000) / $12,500 = 20%, not 25%
The dollar amount of profit is identical — but markup is calculated as a percentage of cost, while margin is calculated as a percentage of revenue. They're measuring the same dollar against different bases.
Average Construction Profit Margins: 2025 Benchmarks by Sector
Current Industry Data
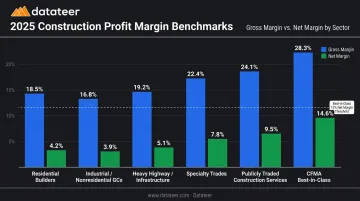
The most reliable current benchmarks come from CFMA's 2025 Financial Benchmarker and NAHB's 2025 builder study. Here's what the data shows across sectors:
| Sector | Gross Profit Margin | Net Profit Margin | Notes |
|---|---|---|---|
| Residential (single-family builders) | ~20.7% avg; top 25% at 29.7% | 8.7% avg in 2023 | NAHB 2025 data; highest in 30+ years |
| Industrial / Nonresidential GCs | Not separately reported | 4.4% (2024) | CFMA 2025; commercial project exposure |
| Heavy Highway / Infrastructure | Not separately reported | 8.3% (2024) | CFMA 2025; improving from 7.2% in 2023 |
| Specialty Trades | 22.4% (2024) | 7.7% (2024) | CFMA 2025 Financial Benchmarker |
| Publicly traded Construction Services | 23.01% TTM Q1 2026 | 6.52% TTM Q1 2026 | CSIMarket; public companies only |
| CFMA Best-in-Class contractors | ~21.8% gross | 12.0% (2024) | CFMA 2025; top performers across all segments |
Why Specialty Trades Outperform
Specialty trades — electrical, mechanical, plumbing, HVAC — consistently post higher margins than general contractors for structural reasons:
- Skill premium: Licensed specialty work is harder to commoditize than general construction
- Less competitive bidding: Fewer qualified firms competing on any given RFQ
- Labor-intensive work: Higher labor content as a share of project cost allows skilled firms to capture margin through productivity rather than just pricing
A specialty firm's 22.4% gross margin versus an industrial GC's lower gross reflects genuine market differentiation — structural barriers to entry that GCs simply don't have.
What "Healthy" Actually Looks Like
Those sector benchmarks tell you where the industry lands. What they don't show is how two contractors with the same gross margin can end up in completely different financial positions. Consider:
- Contractor A: 18% gross margin, 14% overhead rate → 4% net
- Contractor B: 18% gross margin, 8% overhead rate → 10% net
Gross margin confirms that projects are priced right. Net margin is what determines whether the business actually builds wealth. CFMA's Best-in-Class benchmark of 12% net demands both — firms that hit it have solved pricing and overhead discipline, which is why it's the right number to benchmark against rather than the industry average.
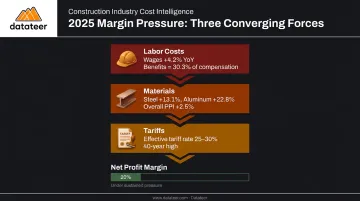
What's Compressing Construction Profit Margins in 2025
Three converging pressures are making 2025 unusually difficult for margin management.
Labor Cost Escalation
Construction wages increased 4.2% year over year as of August 2025 (Deloitte). BLS data shows wages and salaries for construction occupations rose 4.3% for the 12 months ending December 2024.
Why this matters on a fixed-price contract: if labor represents 30% of your project cost and wages rise 4%, that's roughly 1.2 percentage points of gross margin erosion with no corresponding adjustment to the contract price. On a $2M project, that's $24,000 of margin gone.
BLS also reports that benefits represent 30.3% of total private construction compensation — meaning base wages understate your true labor cost if you're not accounting for the full burden in your estimates.
Labor escalation is damaging on its own. Combined with material cost volatility, the margin pressure compounds fast.
Material Costs and Tariff Exposure
AGC's 2025 material cost data shows:
- Steel mill products: +13.1% over 12 months through August 2025
- Aluminum mill shapes: +22.8% over the same period
- Overall materials PPI: +2.5% year over year
The tariff backdrop makes this worse. The White House increased tariffs on steel and aluminum from 25% to 50% ad valorem, effective June 4, 2025. Deloitte estimates the effective tariff rate on construction goods reached a 40-year high of 25–30% in 2025.
For contractors who bid projects 12–18 months before mobilization on lump-sum terms, this exposure isn't theoretical — the contract was signed at one material cost environment, and the project is being built in a completely different one.
When material and labor costs both move against you, the natural hedge is winning more work. The problem is the market is shrinking, too.
Competitive Bidding in a Shrinking Market
Total construction spending fell almost 3% year over year by July 2025, with commercial down 8.2% and manufacturing down 7% (Deloitte). Project starts dropped 20.5% in November 2025 to a seasonally adjusted annual rate of $1.22 trillion (Dodge Construction Network).
Fewer projects available means more contractors bidding on each one — and more willingness to cut price even when costs haven't dropped. Costs rise on one side; revenue per project shrinks on the other. That combination is what makes 2025 particularly hard to manage without real-time visibility into where margin is going.
How to Calculate Your Construction Profit Margin
Three Essential Formulas
| Metric | Formula | Typical Construction Range |
|---|---|---|
| Gross Profit Margin | (Revenue – COGS) / Revenue × 100 | 15–25% for GCs |
| Operating Profit Margin | (Revenue – COGS – Operating Expenses) / Revenue × 100 | 5–12% |
| Net Profit Margin | (Revenue – COGS – Overhead) / Revenue × 100 | 4–8% average; 10–12% Best-in-Class |
Worked Example
Start with a $500,000 project:
Gross Margin Calculation:
- Revenue: $500,000
- Direct costs (COGS): $375,000
- Gross profit: $125,000
- Gross margin: 25%
Net Margin Calculation:
- Apply overhead: $75,000 (15% overhead rate on revenue)
- Net profit: $125,000 – $75,000 = $50,000
- Net margin: 10%
That $75,000 overhead figure isn't arbitrary — it should come from your actual overhead rate: total annual overhead divided by annual revenue, applied proportionally to each project. Plugging in an estimated round number instead is one of the most reliable ways to overstate profitability on paper while losing money in practice.
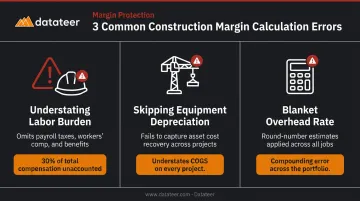
Common Calculation Errors
These mistakes cause contractors to overstate margins consistently:
- Understating labor burden: Base wages aren't your full labor cost. BLS data shows benefits represent 30% of total construction compensation — omitting payroll taxes, workers' comp, and employer costs inflates margin estimates
- Under-allocating equipment depreciation: Depreciation accrues whether or not a piece of equipment is actively billed to a job — skipping this assignment understates COGS on every project it touches
- Using a blanket overhead rate: Calculate your overhead rate annually from actual G&A data, then apply it project-by-project — a round-number estimate introduces compounding error across your portfolio
One more note on the table above: operating margin strips out interest and taxes, which makes it the right metric when comparing operational performance across project types or divisions — use it alongside net margin, not instead of it.
Strategies to Protect and Improve Your Construction Profit Margin
Estimating Discipline
The margin problem often starts in the estimate. Specific practices that reduce the gap between bid and actual:
- Separate labor and material cost lines rather than using blended unit costs — this forces honest accounting of each component
- Build explicit escalation assumptions for multi-year projects rather than holding costs flat from the bid date
- Size contingencies to actual risk — a ground-up structural project and a tenant improvement carry different risk profiles and shouldn't carry the same contingency percentage
- Use fully-burdened labor rates in every estimate, not base wages
Underbidding to win work keeps the backlog full while quietly eroding net profit — it's a revenue solution that makes the margin problem worse.
Contract Structure as Margin Protection
AGC's Tariff Resource Center recommends including price escalation provisions — such as the ConsensusDocs 200.1 Material Price Escalation Amendment — as the best defense against material cost volatility. Other contract protections worth pursuing:
- Escalation clauses tied to the ENR Construction Cost Index for multi-year projects
- Cost-plus or GMP structures for long-horizon work where price certainty is genuinely impossible
- Force majeure and tariff provisions that prevent the contractor from absorbing 100% of unforeseeable cost increases
Overhead Management
Calculate your overhead rate annually: total annual overhead divided by annual revenue. A contractor with the same gross margin as a competitor but 5% higher overhead ends up with 5% less net profit. Common overhead inefficiencies to audit:
- Excess administrative headcount relative to project volume
- Software subscriptions that have accumulated without review
- Office space sized for a previous growth phase
NAHB's 2024 single-family home cost data puts overhead and general expenses at 5.7% of total sales price for residential builders — a useful reference point for benchmarking your own overhead rate.
Project Selectivity
Not all revenue is equally valuable. Low-margin commodity work in highly competitive markets keeps crews busy but doesn't build the business. Track margin performance across multiple dimensions to identify where your firm is actually profitable:
- Project type — commercial, industrial, civil, or tenant improvement
- Client — repeat clients, negotiated work, hard-bid public contracts
- Geography — local markets vs. distant projects with higher mobilization costs
Pursue more of what's profitable and less of what isn't.
Real-Time Job Cost Monitoring
Selecting better projects sets you up to win. Monitoring them in real time determines whether you actually do. Projects go wrong during execution, not just during estimating, and by the time a cost overrun shows up in a month-end report it's often too late to recover the margin.
The contractors who protect margins most consistently catch overruns early — through scope negotiation, crew adjustments, or change orders. That requires visibility into job costs as they accumulate, not three weeks after payroll is cut.
The Real-Time Data Advantage: Catching Margin Fade Before It's Too Late
The Margin Fade Problem
Margin fade is the gap between what you estimated and what you're actually spending — and it widens gradually, transaction by transaction, week by week. The structural problem in construction is that most firms only see the full picture at month-end.
A cost overrun caught in week 3 of a 12-week project is manageable. Discover that same overrun at week 11 and there's no path to recovery: the money is spent, the crew is deployed, and the damage is done.
CFMA is direct about this: margin fade, job borrow, and days of cash on hand should be monitored daily or weekly, not only monthly or quarterly. The 10–20 day lag common in manual WIP reporting means that a problem that emerged in early October may not reach leadership until November, at which point corrective action is no longer viable.
What Manual Reporting Actually Costs
The typical construction finance workflow involves pulling data from ERP systems, reconciling it in Excel, running VLOOKUP formulas between Procore and Sage, and formatting WIP reports for leadership review. This process routinely consumes 10–20 days per month — and produces data that's already stale by the time anyone reads it. Datateer calls this the "Excel Autopsy" problem: forensic analysis on historical data instead of active management of live projects.
The Automated Alternative
Datateer integrates directly with 12 major construction ERPs — Procore, Sage 100/300/Intacct, Viewpoint Vista, Viewpoint Spectrum, Acumatica Construction, Foundation Software, CMiC, Jonas Construction, QuickBooks, and NetSuite — and pulls job cost, WIP, and billing data automatically on an overnight cycle.
The result: WIP reports and margin dashboards that previously took 10–20 days of manual work refresh automatically each morning. Double L Management's Business Analyst described the experience directly: "The very first time we accessed our data through a Datateer analytics dashboard, that one click replaced two weeks worth of prior work."
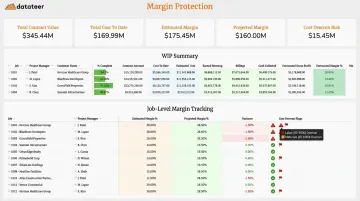
The platform's margin protection dashboards do more than speed up reporting:
- Margin Protection module: Monitors original estimated margin versus current projected margin per job, flags labor overrun, material price escalation, subcontractor cost increases, and change order denial by cost code and phase
- Job Costing & Cost-to-Complete module: Tracks actual costs incurred, committed costs, pending change orders, and projected final cost in real time
- Change Order Impact & Aging module: Identifies stalled change orders where work has been performed but revenue hasn't been recognized — a direct margin leak that's easy to miss in monthly reporting
Implementation takes 2–4 weeks, with flat annual pricing starting at $10,000 per year per data source and unlimited users. No per-seat fees, no per-dashboard charges.
For contractors who want to evaluate their current reporting lag before committing, Datateer offers a free 60-second Construction Data Maturity Audit and a 15-Minute Workflow Audit — both designed to show where visibility gaps are costing margin.
Frequently Asked Questions
What is a good gross profit margin in construction?
CFMA's 2025 benchmarks show specialty trades averaging 22.4% gross margin and NAHB data shows residential builders at 20.7%. For general contractors, 20–25% gross margin is a reasonable benchmark, though the right target depends on your overhead structure and project mix.
What is the difference between markup and margin in construction?
Markup is a percentage applied to your costs to arrive at a bid price; margin is the resulting profit as a percentage of revenue. A 25% markup on $10,000 of costs produces $12,500 in revenue — but that's a 20% margin, not 25%. Confusing the two leads to systematic underbidding.
What is the difference between gross profit margin and net profit margin in construction?
Gross margin measures profitability after direct project costs only. Net margin deducts overhead and all other business expenses too. Gross margin tells you whether projects are priced correctly; net margin tells you whether the business is financially sustainable.
Why do construction companies tend to have low profit margins?
The core structural reasons: intensely competitive bidding, fixed-price contract exposure to cost volatility, long payment cycles, high capital requirements, and thin project margins amplified by overhead. CFMA data consistently shows industry-wide net margins of 4–8% even for well-run firms.
How can a general contractor increase their profit margin?
Five moves with the highest leverage:
- Tighten estimating accuracy using fully-burdened labor rates
- Build escalation protections into contracts to hedge material and tariff exposure
- Reduce overhead as a percentage of revenue by scaling revenue faster than G&A
- Pursue higher-margin project types that match your operational strengths
- Implement real-time job cost visibility to catch overruns while there's still time to act
What is margin fade in construction and how can it be prevented?
Margin fade is the gradual erosion of estimated profit as actual project costs exceed projections — often invisible until month-end reconciliation. Preventing it requires accurate upfront estimating, contract escalation clauses, and job cost monitoring that surfaces variances in time to course-correct.