Introduction
A construction firm can be running three active jobs, billing aggressively, and still end the quarter with almost nothing to show for it. The P&L statement, read correctly, explains exactly why — and most finance teams are only reading half of it.
This guide is written for construction CFOs, finance managers, and advisory CPAs who want to move beyond checking the bottom line once a month.
The P&L is one of the most powerful management tools available — but only when you understand what every line actually measures, where margin erodes before anyone notices, and how to use the data before it's too late to act.
What follows covers the full P&L structure, how to read gross margin benchmarks, the warning signs most firms overlook, and how to move from monthly forensic reporting to real-time margin protection.
Key Takeaways
- A construction P&L measures operating performance — not cash position — and maps directly to where margin is won or lost
- Gross margin percentage is the single most diagnostic number; a declining trend signals pricing, estimating, or cost-tracking problems early
- Company-wide averages hide project-level problems — segmented job-level P&L is where the real picture emerges
- Misclassifying direct costs as overhead and delayed cost entry distort the P&L and corrupt every downstream decision
- Daily ERP-connected dashboards close the reporting lag — finance teams can catch margin fade while there's still time to act
What Is a Construction P&L Statement?
The profit and loss statement — also called an income statement — summarizes revenue, direct job costs, gross profit, operating expenses, and net profit over a specific period. It answers one question: did the firm make or lose money during that time?
Two important distinctions:
- The P&L is not a cash flow statement. A firm can show net profit on the P&L and still have an empty bank account due to timing differences in billing, collections, and payments.
- The P&L is not a balance sheet. It doesn't show assets, liabilities, or net worth — only operating performance for the period.
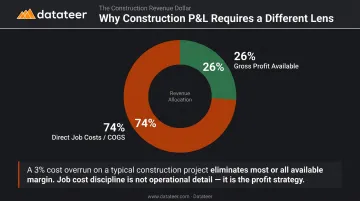
Why does this matter especially in construction? Because direct costs in this industry consume a dominant share of every revenue dollar. CFMA's data shows average construction gross margins around 26% — meaning roughly 74 cents of every dollar goes directly to producing the work. In most service businesses, that ratio is far more favorable.
When COGS is that large, a 3% cost overrun doesn't dent margins — it wipes them. That's why reading a construction P&L requires a different lens than reading one for a retail or service business, and why every section of this guide focuses on the line items that matter most in this industry.
Breaking Down Every Line of a Construction P&L
Think of the P&L as a top-to-bottom funnel. Revenue enters at the top, and each line below represents costs taking a share before net profit remains at the bottom.
One structural variable determines how that funnel looks at any given moment: revenue recognition method. Cash-basis accounting records revenue when payment arrives. Accrual accounting — including percentage-of-completion (PCM) — records revenue as it's earned. The same firm, the same month, can show dramatically different P&L pictures depending on which method is applied.
Revenue
Construction revenue has three components worth tracking separately:
- Contract revenue — progress billings tied to work completed
- Change order revenue — should be tracked distinctly; rising change order volume signals scope creep or chronically low initial estimates
- Other income — equipment rentals, material markups, warranty work
The most dangerous P&L pattern involving revenue: revenue climbing while gross margin shrinks. More work, less return per dollar — a volume treadmill, not actual growth.
Understanding where revenue leaks out starts with the cost line directly beneath it.
Cost of Goods Sold (Direct Job Costs)
COGS in construction includes every cost that would disappear if the firm stopped taking projects:
- Field labor (wages, payroll taxes, burden)
- Materials and equipment rentals/fuel
- Subcontractor payments
- Project-specific fees (permits, inspections, bonds)
The critical classification rule: if a cost is directly tied to producing billable work, it belongs in COGS — not overhead. Misclassifying it inflates gross margin artificially and makes the firm look more profitable at the project level than it actually is.
COGS accuracy also depends on timely, job-coded cost entry. When field receipts, timesheets, and subcontractor invoices lag behind by days or weeks, the gross profit number on the P&L reflects past reality, not current reality. Decisions made from it are unreliable.
Once direct costs are accounted for, what remains above the net profit line is overhead — the fixed cost of keeping the firm running.
Operating Expenses and Overhead
Overhead is what the firm spends whether or not any projects are active. Key line items include:
- Office rent and utilities
- Administrative salaries
- Insurance premiums (general liability, E&O)
- Vehicle and equipment costs not tied to specific projects
- Software subscriptions and professional fees
- Depreciation and interest expense
CFMA's 2024 Construction Financial Benchmarker reports SG&A expenses at 11.8% of revenue for typical firms and 10.8% for Best in Class. If your overhead is running significantly above that range, it deserves scrutiny regardless of how strong gross margin looks.
Net profit is what's left after overhead is subtracted from gross profit. A firm can have a healthy gross margin and still lose money if overhead is bloated or growing faster than revenue.
Gross Profit: The Margin Number That Reveals Your Business Health
Gross profit in dollar terms shows how much is available to cover overhead and generate net income — but the dollar figure alone can mislead. Gross margin as a percentage is what tells you how efficiently the firm converts revenue into that pool, and it's the number that reveals whether growth is actually working in your favor.
Consider two firms:
| Firm A | Firm B | |
|---|---|---|
| Revenue | $8M | $12M |
| Gross Profit | $2.1M | $2.2M |
| Gross Margin | 26.3% | 18.3% |
Firm B has more revenue but nearly the same gross profit. After overhead is subtracted, Firm A will almost certainly show stronger net income. Revenue size is not the metric that matters. Margin percentage is.
Industry Benchmarks
CFMA's 2025 Financial Benchmarker, based on 1,558 companies, reports:
| Segment | Metric | Benchmark |
|---|---|---|
| Specialty Trades | Gross profit margin | 22.4% |
| Heavy Construction | Net income before taxes | 8.3% |
| Industrial & Nonresidential | Net income before taxes | 4.4% |
| Best in Class (all segments) | Net income before taxes | 12.0% |
| Typical firm (all segments) | Net income before taxes | 6.7% |
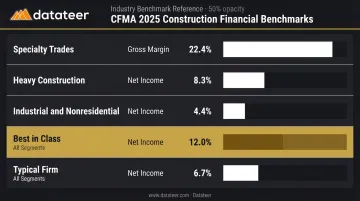
Use these as your baseline. If your gross margin falls well below the specialty trades benchmark — or net income trails the 6.7% typical figure — that gap points directly to cost classification, estimating accuracy, or overhead structure. Those are the three levers worth pulling first.
The Averaging Problem
A company-wide gross margin of 28% sounds healthy. But if three jobs are running at 35% and two are running at 5% or negative, the average obscures a serious problem. The only solution is job-level P&L tracking with estimated vs. actual cost comparisons reviewed after every project closes.
What a Declining Trend Tells You
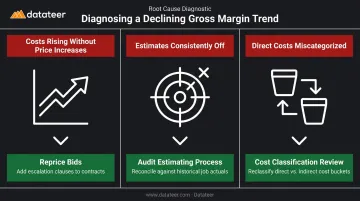
Gross margin trending down over 3–6 months has distinct root causes, and each requires a different response:
- Costs rising without price increases — reprice open bids or add contract escalation clauses
- Estimates consistently off — audit the estimating process against historical cost actuals
- Direct costs miscategorized as overhead — run a cost classification review to correct the allocation
Spotting the trend early is what creates room to act. By the time a single month looks bad, the damage is usually already done across multiple projects.
How to Use Your Construction P&L as a Strategic Decision-Making Tool
Monthly Trend Analysis
Running 12 months of P&L side by side reveals what single-month snapshots never show: seasonal dips, overhead creep, margin fade on specific project types. Individual months can be misleading due to timing differences in cost recognition. Trends over 6–12 months are more reliable and more honest.
Connecting the P&L to Estimating
When finance teams track estimated vs. actual costs on every closed job, patterns emerge. Labor consistently running 10–15% over bid alongside subcontractor costs exceeding projections on a specific project type — each pattern makes the next estimate more precise.
FMI's 2023 Labor Productivity Study found that a 6% improvement in labor productivity correlates with an average 50% increase in profitability. That compound effect starts with reviewing job actuals and feeding those findings back into estimating.
Breakeven Analysis
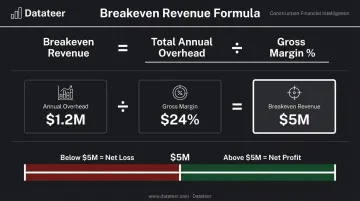
Breakeven revenue = total annual overhead ÷ gross margin percentage. This gives you the minimum revenue required before generating net profit.
Example:
- Annual overhead: $1.2M
- Average gross margin: 24%
- Breakeven revenue: $1.2M ÷ 0.24 = $5M
Every dollar below $5M in revenue represents a net loss. Every dollar above it contributes to net profit. This number should inform every hiring decision, growth target, and opportunity evaluation.
P&L-Driven Work Selection
Job-level P&L data should directly shape how you bid and where you focus business development. When certain project types consistently deliver 30%+ gross margins while others barely clear 15%, the right response is to act on that gap — not ignore it.
That data should drive:
- Prioritizing bid opportunities in high-margin project categories
- Deprioritizing or repricing work in consistently low-margin segments
- Redirecting marketing spend toward more profitable client types
- Flagging underperforming project types for a scope or pricing review
Assessing Readiness to Grow
Before adding overhead — a new hire, a truck, a larger project requiring expanded staffing — the current P&L should show whether gross profit provides enough cushion to absorb the ramp-up period. A reliable signal: if gross margin doesn't cover current overhead by at least 10–15% before the expansion, the ramp-up period will likely push the firm into a net loss position before the new revenue materializes.
Common P&L Red Flags and Mistakes Construction Companies Make
Misclassification of Direct Costs
This is the most structurally damaging error. When direct costs are posted to overhead — or overhead costs bleed into COGS — gross margin becomes fiction. The practical test: Would this cost exist if we had no active projects? If the answer is no, it belongs in COGS.
The reverse error matters too. When overhead costs get coded to specific jobs, job-level margins look thinner than they are and the company-wide P&L appears leaner on overhead than it actually is.
Delayed Cost Entry
Field receipts, timesheets, and subcontractor invoices entered days or weeks late create a P&L that always lags reality. By the time a cost overrun appears on the report, the project may already be near completion. The opportunity to intervene has passed.
Job-cost data needs to flow in near real time. Without it, the P&L becomes a forensic document rather than a management tool — useful for explaining what went wrong, not for stopping it.
Owner Compensation Blind Spot
Contractors who take irregular draws instead of a market-rate salary create a P&L that looks more profitable than it is. Owner compensation must be treated as a real business cost — in COGS if the owner is doing field work, in overhead if managing the business. Without this adjustment, net profit is inflated and the numbers can't be trusted for benchmarking or decision-making.
The Single-Report Trap
Running only a company-wide P&L and never segmenting by job, project type, or division means problems hide inside averages. Firms that only review consolidated results miss the warning signs. Common blind spots include:
- A division or project type consistently underperforming while profitable work masks the loss
- A single high-margin job inflating company-wide gross margin for the quarter
- Overhead misallocation that only surfaces during year-end review
A division losing money on every project won't show up on a consolidated P&L until the damage is already done.
From Static Reports to Real-Time P&L Intelligence
The traditional construction P&L workflow has a structural bottleneck: ERP data must be manually exported, cleaned, reformatted in spreadsheets, and assembled into reports. A Double L Management analyst put it directly: before automation, producing a usable picture required approximately two weeks of work. By the time that picture existed, the projects feeding the numbers had moved on.
That lag is a management problem, not just an inconvenience. When margin fade becomes visible weeks after the fact, the corrective actions available are limited or gone entirely.
How Automated Dashboards Change the Equation
Platforms like Datateer connect directly to the firm's ERP — Procore, Sage 100/300/Intacct, Viewpoint Vista, Viewpoint Spectrum, Acumatica Construction, Foundation Software, CMiC, Jonas Construction, QuickBooks, NetSuite, and others — and automate the entire data pipeline. Three components drive this automation:
- Zero-lift ERP connection — direct extraction without manual CSV exports
- Automated data cleaning — cost code standardization, broken entries fixed, data logic mapped across systems
- Daily dashboard refresh — financial data available each morning without manual intervention
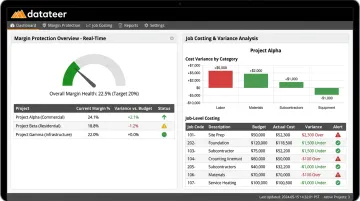
For P&L and margin monitoring specifically, Datateer's Margin Protection module tracks estimated vs. projected margin per job continuously, flags labor overruns, material price escalation, subcontractor cost increases, and change order denials — surfacing the specific cost codes behind the margin slide before month-end.
The Job Costing & Cost-to-Complete module provides real-time variance at job, phase, and cost-code level, replacing the painful month-end cost-to-complete refresh with continuous automated tracking. Segmented views by job, project type, or division are available without additional configuration.
The CFM Transformation
When P&L data flows automatically, finance managers stop spending their time gathering and formatting. Instead, they focus on analysis — coaching project managers on margin protection, advising leadership on which work to pursue, and shaping decisions before problems calcify into losses. The role shifts from explaining last month to influencing next quarter.
Datateer's platform is implemented in 2–4 weeks, with all 12 dashboards live on day one. Pricing starts at $10,000/year per data source, including:
- Unlimited users — no per-seat fees
- All 12 dashboards included — no per-dashboard charges
- Data flowing before annual fees begin
Frequently Asked Questions
What is a profit and loss (P&L) statement in construction?
A construction P&L summarizes revenue, direct job costs, gross profit, operating expenses, and net profit over a specific period. It answers whether the firm made or lost money operationally — separate from cash position, which is measured by the cash flow statement.
What are common red flags to look for in a construction P&L?
The top warning signs: declining gross margin over 3–6 months, overhead growing as a percentage of revenue, wide gaps between estimated and actual COGS on closed jobs, and revenue increasing without corresponding net profit improvement. Each pattern points to a different underlying cause — and a different fix.
How does a construction P&L differ from a standard business P&L?
Construction P&Ls carry unusually large COGS relative to revenue — often in the 70–75% range — requiring project-level cost tracking that most industries don't need. Revenue recognition methods like percentage-of-completion also shift when revenue appears, which can make the P&L look materially different depending on the method used.
How often should construction companies review their P&L?
Monthly at minimum for company-wide review. Job-level P&L should be reviewed after every project closes, and monitored continuously on active projects.
What is the difference between gross profit and net profit on a construction P&L?
Gross profit is revenue minus direct job costs. Net profit is gross profit minus overhead. A firm can show a strong gross margin and still post a net loss if overhead is too high — which is why tracking both numbers, not just the bottom line, needs to be standard practice, not an afterthought.
How does revenue recognition method affect my construction P&L?
Cash-basis records revenue when payment is received; percentage-of-completion records it as work is performed. Using the wrong method for the firm's situation can make the P&L appear healthier or weaker than actual performance — which matters for both internal decisions and lender/bonding reviews.