Introduction
Construction runs on thin margins — and CFMA's 2024 Construction Financial Benchmarker, analyzing 1,290 contractor financial statements, puts the average net income before taxes at 6.3% of revenue. Industrial and nonresidential firms sit even lower at 4.1%. Best-in-class contractors reach 11.9% — but for most firms, there's very little room for error.
The dangerous part isn't a single catastrophic loss. It's a slow, compounding bleed across labor hours, uncommitted purchase orders, unapproved change orders, and stale financial reports — invisible until a job closes and the damage is already done.
The firms that consistently protect those margins don't let problems stay invisible. They see their financial position clearly and act while there's still time to fix it — and that capability comes from having the right software infrastructure, not from bidding tighter or working longer hours.
Key Takeaways
- Margin erosion in construction builds from multiple small failures: labor slippage, missed change orders, untracked committed costs, and lagging reports
- Manual WIP preparation introduces reporting lags that turn small problems into expensive ones before anyone sees them
- Construction financial software gives CFOs and controllers real-time job cost visibility, WIP accuracy, and early warning signals before losses compound
- Key capabilities: live WIP reporting, committed cost tracking, cost-to-complete forecasting, and change order management
- Platforms like Datateer reduce WIP report preparation from a weeks-long manual process to an automated daily refresh
Where Construction Margins Actually Disappear
Margin fade isn't the same as a simple cost overrun. It's the gradual gap between the margin estimated at bid and the margin collected at closeout — and it rarely traces back to one decision. It compounds across multiple cost categories simultaneously, often staying invisible until the job wraps up and recovery options are gone.
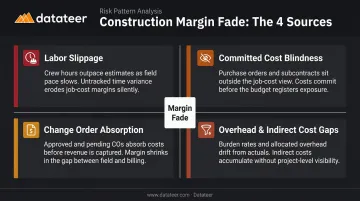
Four categories drive most of it:
1. Labor slippage
Labor overruns are the hardest leakage to catch in real time. Hours accumulate against cost codes, productivity drifts, and the variance only surfaces weeks after it has already locked in. FMI's 2023 Labor Productivity Study found that 60% of respondents believe 11% or more of field labor costs are wasted — and that among self-performing contractors with an average 4% operating margin, a 6% productivity improvement can produce a 50% increase in profitability.
2. Committed cost blindness
Many job cost systems only track paid invoices. The result is a systematically optimistic picture: a job can appear on budget while carrying open purchase orders and subcontract commitments that haven't yet invoiced. The costs are real and committed. They just haven't shown up in the system yet.
3. Change order absorption
FMI reports that change order inefficiencies affect 48% of contractors as a productivity challenge. The specific failure pattern: approved change orders go unbilled, pending change orders get absorbed into job costs without a corresponding revenue entry, and markup discipline erodes when the change order process lives in a spreadsheet disconnected from the financial system.
4. Overhead and indirect cost gaps
Underestimated project duration extends overhead absorption. Warranty and punchlist costs exceed reserves. Indirect costs tied to pre-construction or estimating fall through the cracks when tracking across multiple concurrent jobs. Individually, each gap looks manageable. Together, they routinely erase the margin that looked healthy at bid.
Why Lagging Data Turns Margin Problems into Margin Disasters
The Reporting Lag Problem
AICPA guidance calls for WIP schedules to be updated monthly — but for firms still running manual spreadsheet processes, the preparation work itself can eat weeks. By the time a problem becomes visible in a WIP report, additional costs have already accumulated against that job.
Double L Management described the reality directly: their team was doing two weeks of work to produce each reporting cycle before moving to Datateer's automated dashboards.
A labor overrun identified in week two of a four-week billing cycle can still be addressed. The same overrun identified at month-end closeout — after two more weeks of hours have posted — is largely a forensic exercise at that point.
The Forensic Accounting Trap
That two-week reporting lag is precisely how finance teams end up in the forensic accounting trap: data arrives after the window for action has closed, and CFOs spend their time explaining what went wrong rather than preventing it. Finance becomes a backward-looking function — producing post-mortems instead of early warnings.
The cost of that timing gap is concrete. Margin problems caught during execution still have recoverable options:
- Crews are still on site and schedules can shift
- Change order conversations are still open
- Subcontractors can be redirected before costs lock in
The same problems surfaced at closeout have none of those options.
The Field-to-Office Data Gap
The lag gets worse when project managers, field supervisors, and finance teams are working from different, unsynchronized data sets. When the PM's numbers don't match the controller's numbers, the first conversation is about which dataset is right — not about what to do next. That reconciliation delay is exactly the window where margin problems go from recoverable to permanent.
The Software Capabilities That Protect Construction Margins
Real-Time WIP Reporting and ERP Integration
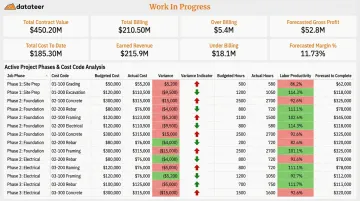
A properly constructed WIP report shows four numbers simultaneously: estimated costs, actual costs, committed costs from open POs and subcontracts, and projected cost at completion. All four are required for the report to be actionable. A report showing only paid actuals gives an incomplete, optimistically skewed view of where the job actually stands.
Datateer's WIP dashboard delivers all four, pulling directly from the ERP rather than manually exported spreadsheets. The system calculates percentage complete, earned revenue, billed revenue, and over/under-billings automatically — replacing the month-end CSV export and VLOOKUP cycle with an overnight automated refresh. What Double L Management called "two weeks worth of prior work" becomes a single click.
Why ERP integration specifically matters:
- Eliminates broken formulas, copy-paste errors, and version conflicts by removing manual exports entirely
- Standardizes cost codes automatically across systems, including reconciling Procore project commits to Sage invoices
- Gives finance teams current project health without waiting for month-end — no human required to move the data
Live Job Cost Tracking and Labor Variance Alerts
When hours flow from field time entry into the job cost system by cost code and phase, a productivity variance appears while the job is still running. That detection window — not closeout — is when the information is still actionable.
Datateer's Job Costing & Cost-to-Complete module provides budget-vs-actual visibility at the cost-code level during active execution. A project manager who sees a labor variance on Tuesday can investigate whether it stems from scope expansion, a design change, a productivity issue, or an unrealistic original estimate. Each cause has a different corrective response. All of them require catching the problem while the work is still in progress.
The platform's Labor & Materials Productivity dashboard is specifically designed to surface budget blowouts early in the week — before the variance compounds into a margin problem.
Change Order and Completion Forecasting
Change order management handled inside the same system as project budgets eliminates the reconciliation gap that causes so much margin absorption. When approved change orders update both the budget and the contract value simultaneously (with pending change orders tracked as potential adjustments), the financial picture stays coherent rather than fragmenting across a spreadsheet nobody fully trusts.
Datateer's Change Order Impact & Aging module tracks change orders across their full lifecycle (pending, approved, denied, executed) with aging by days since submission. Stalled change orders — work performed but not yet approved — become visible before they become margin problems.
Cost-to-complete forecasting is the most forward-looking tool in the stack:
| Report Type | What It Shows | When It Matters |
|---|---|---|
| Cost report | Where costs have been | Historical record |
| Completion forecast | Where costs are headed | Execution decisions |
Datateer replaces the periodic manual cost-to-complete refresh with continuous automated CTC, viewable across the full project portfolio simultaneously — so finance leadership sees the company-wide margin picture without scheduling individual job reviews.
How the Right Tools Transform the Construction CFM Role
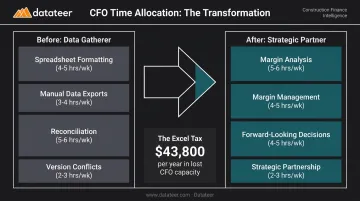
The most concrete shift is one of time allocation. When WIP reports and job cost dashboards are automated and current, the CFO or controller stops spending most of their week on spreadsheet formatting and data reconciliation. That time moves to analysis, interpretation, and proactive margin management.
Datateer's internal positioning describes this shift as moving from "Data Gatherer" to "Strategic Partner." The Excel Tax Calculator tool helps firms put a number on it: 40 hours per month across two staff members at a typical salary works out to roughly $43,800 in annual "Excel Tax" — time spent producing numbers rather than acting on them.
That reclaimed time reshapes how financial meetings run. When leadership works from a single, trusted source of truth — rather than competing spreadsheets prepared by different people — the conversation changes. Instead of spending the first 20 minutes of a project review debating whose data is right, the team moves directly to what to do about it.
Three practical changes that follow:
- Faster decisions: Margin problems identified during execution have recovery options; the same problems identified at closeout don't
- Clearer accountability: PM scorecards and cost variance data at the cost-code level make office-versus-field conversations data-backed rather than anecdotal
- Better forecasting: Portfolio-level cost-to-complete visibility gives leadership a current read on company-wide margin and cash position without manually assembling the data
What to Look for in Construction Financial Software
Not all platforms deliver equal value. Three criteria matter most when evaluating whether a platform will actually protect margins.
1. Integration depth over feature count
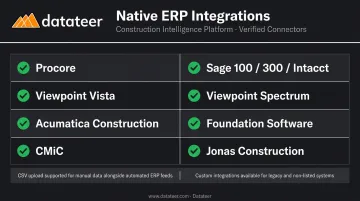
The decisive question is whether the platform pulls data directly from your ERP in real time with standardized cost codes — not what the dashboards look like in a demo. Look for native integrations with the ERPs already in use:
- Procore
- Sage 100 / 300 / Intacct
- Viewpoint Vista and Spectrum
- Acumatica Construction
- Foundation Software
- CMiC
- Jonas Construction
Generic API connectors that require ongoing IT maintenance introduce the same fragility as the spreadsheet workflows they're supposed to replace.
Datateer integrates natively with 12+ construction ERPs and supports CSV uploads for data sources outside that list, with custom integrations available for legacy systems.
2. Whether the platform shows the full financial picture
A minimum viable construction financial dashboard must show estimated, actual, committed, and projected-at-completion costs for every active job. Any platform showing only paid actuals is giving a misleading picture of job health. The committed cost column — open POs and subcontract commitments not yet invoiced — is what separates a real project health view from a misleading one.
3. Total cost of ownership and time-to-value
Consider setup time, pricing structure, and how long before dashboards are usable. Datateer's flat annual pricing starts at $10,000 per year per data source with unlimited users — no per-seat fees, no per-dashboard costs, no hidden implementation charges. Setup runs 2–4 weeks, with yearly fees starting only once data is flowing. That's a different model entirely from BI initiatives that require months of configuration before delivering anything usable.
Frequently Asked Questions
What is an ERP in construction?
An ERP (Enterprise Resource Planning) system in construction is the core platform managing financial accounting, job costing, payroll, and project data. Common examples include Sage, Viewpoint Vista, Acumatica, and Procore. It's the foundational data source from which financial reporting and analytics tools draw their information.
What is margin fade in construction, and how does software prevent it?
Margin fade is the gradual gap between the margin estimated at bid and the margin collected at closeout, driven by labor slippage, change order absorption, and missed committed costs. Software prevents it by surfacing these variances during execution, while the job is still running and corrective action is possible.
What is WIP reporting in construction and why does it matter?
WIP (Work in Progress) reporting compares costs incurred to revenue recognized across active projects to show true project profitability at any point in time. Stale WIP reports can mask significant overruns — showing profit on paper that's already gone by the time finance sees it.
Why do construction companies lose margin even on well-managed projects?
Margin loss typically comes from three sources: committed costs not yet invoiced, labor productivity drift between pay periods, and change orders approved but never billed. Without real-time visibility, these problems don't surface in cost reports until recovery is no longer possible.
How is construction financial software different from standard accounting software like QuickBooks?
Standard accounting software tracks transactions without understanding project context. It doesn't manage cost codes, committed costs, WIP, or progress billing by job. Construction-specific tools treat the project as the core financial unit, tracking costs and revenue at the job, phase, and cost-code level throughout execution.
How quickly can a construction firm expect improved margin visibility after implementing the right software?
With direct ERP integration, data can be flowing within 2–4 weeks. The value is immediate: once project-level WIP and cost dashboards replace the manual reporting cycle, finance teams have current data without waiting for month-end, shifting the detection window from weeks to days.