Introduction
Construction finance teams rarely lose money because the warning signs weren't there. They lose money because the data arrived too late.
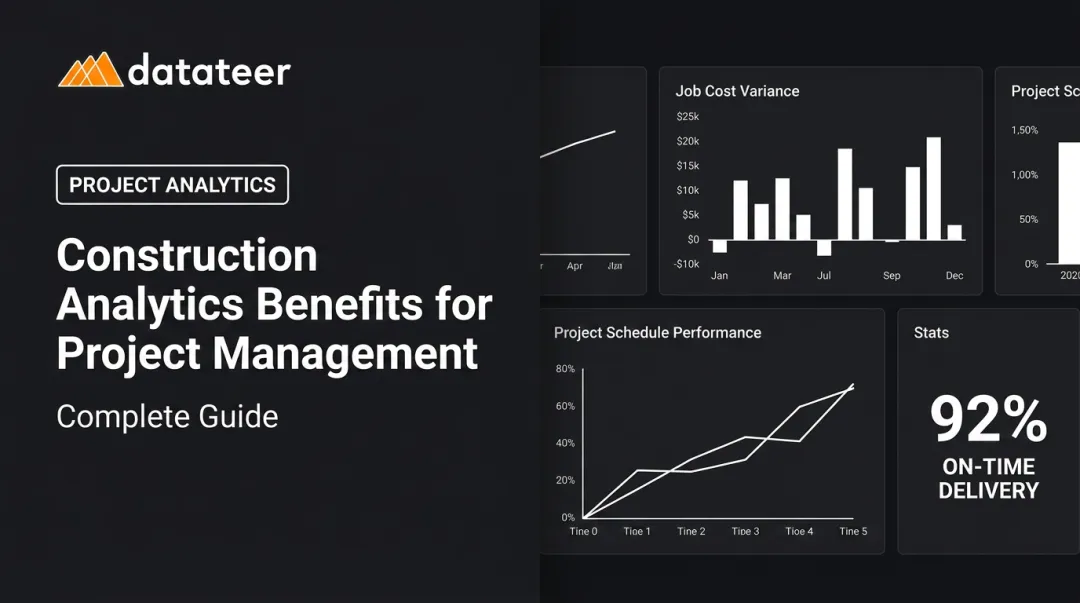
When a WIP report finally flags a cost overrun, the crew has already burned through the labor budget. When the job cost summary confirms margin fade, the subcontractor's change orders are locked in. Traditional reporting describes what already happened — often weeks after the fact — leaving finance teams with no room to course-correct.
According to KPMG's 2023 Global Construction Survey, 37% of construction firms missed budget or schedule targets by 20% or more in the past year due to ineffective risk management. That's a structural problem, not a one-off failure — and backward-looking reporting is at the root of it.
Predictive analytics changes this by converting historical and real-time project data into forward-looking signals, surfacing problems while there's still time to act. This article focuses specifically on the financial and operational applications that matter most to construction CFOs, controllers, and project finance teams.
Key Takeaways
- Traditional WIP and job cost reporting describes the past; predictive analytics forecasts what happens next
- Cost overruns, margin fade, and cash shortfalls all produce early warning signals — but only when your data pipeline is clean and current
- Clean, real-time ERP data is the prerequisite for any reliable predictive model
- Finance teams that shift from forensic accounting to forward-looking analysis become strategic advisors — not just scorekeepers
- Implementation doesn't require a multi-year BI initiative — a phased approach delivers value quickly
What Is Predictive Analytics in Construction Project Management?
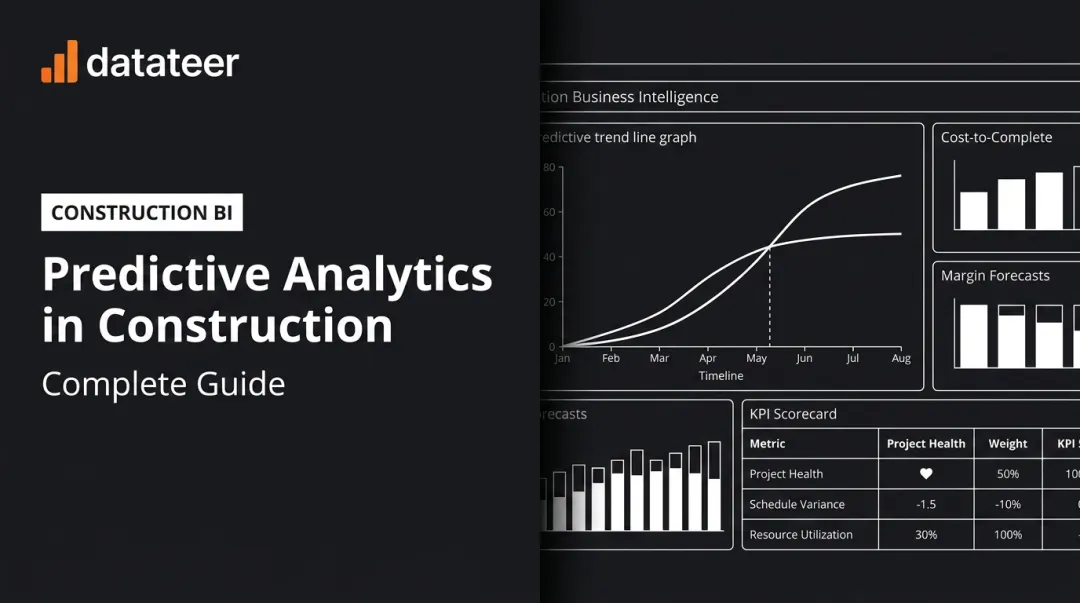
Predictive analytics uses historical data, statistical modeling, and machine learning to forecast future outcomes before they occur: cost overruns, schedule slippage, cash flow shortfalls. That's the core distinction from descriptive analytics, which only tells you what already happened.
In construction specifically, the contrast looks like this:
| Approach | What It Does | When You Get the Signal |
|---|---|---|
| Descriptive (forensic) | Reports completed-period actuals | 10–20 days after period close |
| Predictive | Forecasts likely future outcomes | While the project is still in progress |
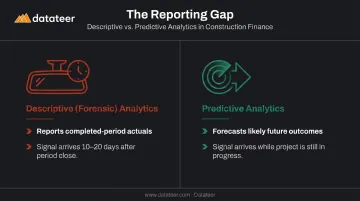
A WIP report assembled manually from spreadsheets is a forensic document. By the time it's compiled, reconciled, and distributed, the underlying project data is already weeks old. Predictive analytics replaces that lag with a live, continuously updated view. The percentage-complete calculation, over/under-billing position, and projected job cost all reflect what's happening now — not what happened last month.
What Data Feeds a Predictive Model in Construction?
The inputs that matter most include:
- Actual costs incurred, committed costs, and open POs from ERP job cost data
- Earned revenue versus billed revenue, including retainage held and owed
- Labor hours by cost code, tracked actual versus budgeted by crew and phase
- Schedule data: percent complete, milestone dates, and sequencing
- Historical job performance — prior cost-to-complete patterns and margin outcomes
When these data streams are clean, centralized, and current, predictive models generate reliable signals. When they're fragmented across spreadsheets and siloed systems, the forecasts are unreliable, or nonexistent.
Why Construction Finance Teams Need Predictive Analytics Now
McKinsey's analysis of 532 large-scale infrastructure projects found average cost overruns of at least 79% relative to initial budget estimates, with schedule delays averaging 52%. A separate KPMG survey found only 50% of project owners reported their projects completing on time.
Those figures point to a structural problem — and backward-looking financial reporting is a core part of it.
The Data Lag Problem
Manual assembly of WIP schedules, job cost summaries, and cash flow statements creates an unavoidable lag. By the time margin fade shows up in a month-end report, the project has already absorbed the damage. At that point, there's no corrective window — only documentation of the loss.
Double L Management's Business Analyst described the pre-Datateer state plainly: "The very first time we accessed our data through a Datateer analytics dashboard, that one click replaced two weeks worth of prior work." Two weeks of manual effort to produce a report that was already outdated the moment it was finished.
Complexity Compounds the Problem
A firm running five simultaneous projects across different phases, subcontractors, and cost codes cannot reliably spot cross-portfolio risk through manual spreadsheet review. FMI reported that 96% of engineering and construction data goes unused — and only 55% of construction firms have a formal data plan. The data exists; the infrastructure to act on it rarely does.
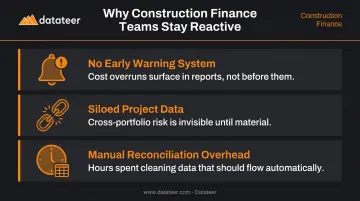
That gap shows up in three ways finance teams consistently report:
- No early warning system — cost overruns surface in reports, not before them
- Siloed project data — cross-portfolio risk is invisible until it's already material
- Manual reconciliation overhead — hours spent cleaning data that should be flowing automatically
The Evolving Role of Construction Finance
Today's construction CFOs and finance managers are expected to anticipate problems, not document them after the fact. That role requires forward-looking tools — and the data infrastructure to support them in real time.
Key Applications: Where Predictive Analytics Transforms Construction Projects
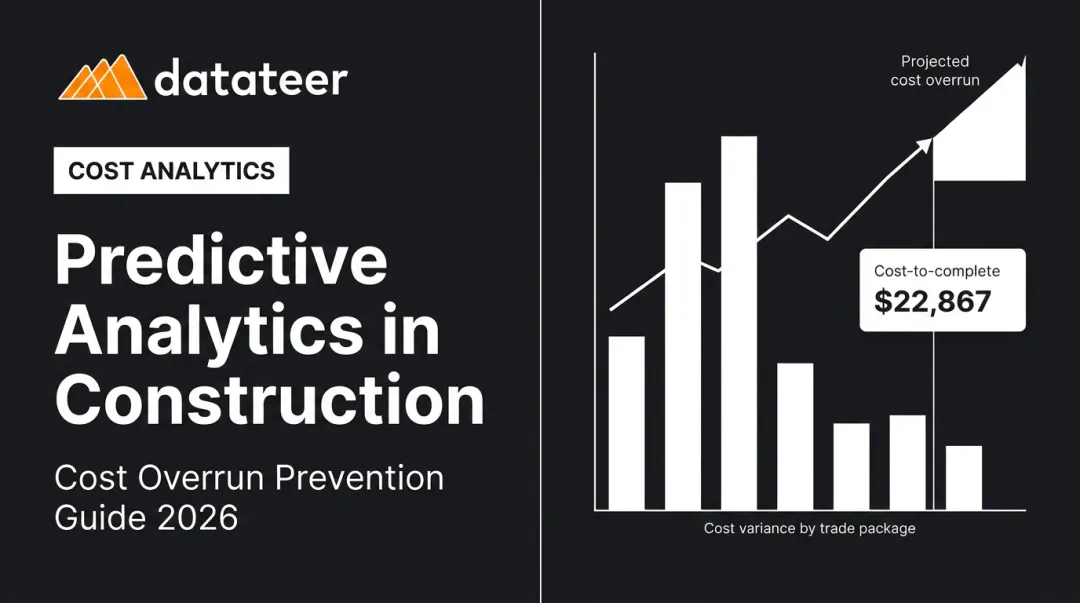
Cost Forecasting and Budget Overrun Prevention
Predictive cost models analyze historical cost-to-complete patterns, current job cost actuals, committed costs (open POs and subcontracts), and schedule progress together — as an integrated view. The output is a projected final cost that updates continuously, giving finance teams something monthly closes can't: early warning.
This matters because 83% of KPMG survey respondents identified improving the estimating accuracy of materials and equipment as their single biggest priority. Predictive cost forecasting directly addresses this by flagging divergence from budget while there's still time to intervene: reassigning crews, negotiating change orders, or adjusting scope before a loss is locked in.
Datateer's Job Costing & Cost-to-Complete Analytics module automates this process — pulling actual costs, committed costs, pending change orders, and projected final cost from ERP data in real time, with variance analysis at job, phase, and cost code levels.
Schedule and Resource Risk
Schedule slippage creates financial problems just as surely as cost overruns. Extended general conditions, liquidated damages, and productivity losses from out-of-sequence work all carry direct cost consequences.
Time series analysis applied to project schedule data can identify early indicators of delay risk: labor productivity trending below plan, sequencing gaps, or milestone slippage patterns that historically correlate with downstream overruns. Catching these signals early converts a schedule problem into an actionable management decision before it becomes a financial write-off.
Datateer's Labor & Materials Productivity dashboard surfaces labor budget variances by Tuesday rather than three weeks after payroll — giving project managers a real-time window into crew performance before the budget is blown.
Supply Chain and Procurement Risk
Material price volatility has made procurement risk a financial planning problem, with direct exposure to project margins. Recent market data illustrates how severe that exposure can be:
- Steel mill products rose 90.3% in 2021 (AGC/BLS data)
- Ready-mixed concrete climbed 11.1% in 2023
Both movements can unravel project budgets built on earlier cost assumptions.
Predictive analytics applied to supplier performance data, material lead times, and historical procurement patterns can surface exposure before it becomes a work stoppage. Datateer's Material Price Escalation Analytics monitors purchased costs against bid-estimate unit prices and live market indices, then rolls escalation impact up to project margin — so controllers see the financial exposure, not just the price movement.
The Financial Use Cases That Matter Most
WIP Accuracy as a Predictive Signal
A WIP report built on real-time ERP data works differently than one assembled manually at month-end. When percentage-complete calculations, over/under-billing positions, and projected job costs refresh automatically from the source ERP, the WIP schedule becomes a live management tool rather than a compliance artifact.
Datateer's WIP Reporting module automates the full calculation directly from ERP data:
- Percentage complete and earned revenue
- Billed revenue, costs in excess of billings, and billings in excess of costs
- Projected margin per job
The standard refresh is overnight, replacing the 10–20 day manual WIP cycle with a near-real-time view. That means catching a margin problem while a project is still in progress — not after the period closes.
Margin Fade Detection
Margin fade rarely announces itself. It shows up gradually — labor hours per unit creeping above plan, a subcontractor logging change orders that haven't been approved by the owner, material costs drifting above the bid estimate. Each signal individually looks manageable. Together, they produce a loss job.
Datateer's Margin Protection module monitors original estimated margin versus current projected margin per job. It flags variance drivers by type and surfaces the specific cost codes behind the deterioration:
- Labor overruns against plan
- Material costs above bid estimate
- Subcontractor cost increases
- Unapproved or denied change orders
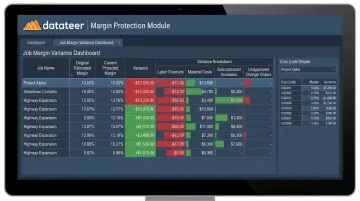
The goal is in-progress oversight — catching margin fade with enough runway to fix the project, not three weeks after monthly close.
Cash Flow and Liquidity Forecasting
Profitable construction firms run into cash problems when billing schedules, retainage releases, and subcontractor payment obligations aren't modeled together. A 13-week cash flow forecast that combines real-time project burn rates, AR aging, and retainage schedules lets CFOs spot liquidity gaps weeks before they materialize.
Datateer's Forecasted Liquidity dashboard projects bank balance six months out, incorporating retainage held and owed, burn rates by active project, and collections timing — so cash shortfalls can be addressed proactively rather than discovered at the point of crisis.
Portfolio-Level Risk Aggregation
When each project is tracked in a separate spreadsheet, there's no portfolio view. A finance team managing eight simultaneous jobs cannot see which three are trending toward loss, which two are significantly under-billed, or what the firm's aggregate margin exposure looks like — without hours of manual consolidation.
Datateer's Strategic Health Dashboards aggregate job-level signals into a single executive view: margin by project, WIP-to-billings ratio, cash conversion velocity, and 50+ construction KPIs computed automatically from ERP data. CFOs and owners get a real-time read on firm-wide exposure — without waiting for the monthly close to tell them where they stand.
Building the Data Foundation for Predictive Analytics
Predictive analytics is only as reliable as the data feeding it. Most construction analytics initiatives break down at the data pipeline stage, long before any model runs.
Autodesk and FMI research found that poor data may have cost the global construction industry $1.85 trillion in 2020, with 30% of construction professionals reporting that more than half of their data is bad. Reliable forecasts require a clean, connected data foundation — starting with these three prerequisites.
1. Automated ERP Integration
Manual data re-entry, CSV exports, and VLOOKUP-dependent spreadsheets introduce errors at every step. A direct, automated sync from the firm's ERP to an analytics layer eliminates these failure points. Datateer integrates with 12+ major construction ERPs (Procore, Sage, Viewpoint Vista, Viewpoint Spectrum, Acumatica Construction, Foundation Software, CMiC, and Jonas Construction), with custom integrations available for systems outside the standard list.
2. Cost Code Standardization
Inconsistent cost code structures across projects are one of the most common data quality problems in construction. If the same cost type is coded differently across jobs, trend analysis and portfolio-level aggregation produce meaningless results. Datateer's automated data cleaning engine standardizes cost codes across systems, catches malformed entries, and maps each firm's unique data logic into a unified structure — configured during the 2–4 week implementation.
3. A Single Source of Truth
When field teams, project managers, and finance work from different data versions, predictive models generate conflicting signals — and debates about whose numbers are right replace decisions about what to do. A unified data environment where everyone accesses the same auto-refreshed numbers is what makes forecasts actionable rather than debatable.
How to Get Started with Predictive Analytics in Your Construction Firm
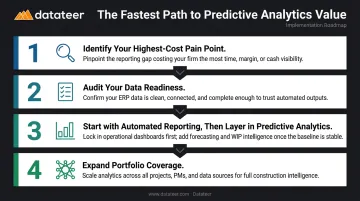
The fastest path to value is starting narrow, not trying to build everything at once.
Identify your highest-cost pain point. Is it margin fade going undetected? WIP reports arriving too late? Cash flow surprises creating vendor friction? Focus the first analytics effort on the one or two problems causing the most damage.
Audit your data readiness. Before selecting tools, assess the quality, completeness, and timeliness of your ERP data. Dodge Construction Network reported that 76% of general contractors experienced data integration challenges — knowing where your gaps are prevents a failed rollout. Datateer's free 60-second Construction Data Maturity Audit provides a quick read on where your firm sits.
Start with automated reporting, then layer in predictive analytics. Replace manual reporting with automated dashboards that surface lagging indicators faster. Once the data pipeline is clean and consistent, trend analysis and predictive models become reliable. Datateer's 2–4 week setup gets data flowing before annual fees begin, reducing implementation risk while delivering measurable value quickly.
Expand portfolio coverage. Once one domain is working — say, real-time WIP and margin monitoring — extend the same data infrastructure to cash flow forecasting, labor productivity, and cross-project risk aggregation.
Following this sequence, firms of any size can build a reliable analytics capability. What separates the ones that see results is clean data, automated pipelines, and finance teams positioned to act on what the numbers reveal — not the sophistication of the technology itself.
Frequently Asked Questions
What is predictive analytics in construction project management?
Predictive analytics uses historical project and financial data, statistical modeling, and machine learning to forecast future outcomes — such as cost overruns, schedule delays, or cash flow shortfalls. Unlike traditional reporting, which describes what already happened, predictive analytics generates signals early enough for teams to intervene.
How does predictive analytics help prevent cost overruns in construction?
Predictive models continuously analyze job cost trends, labor productivity, and committed costs against historical patterns — flagging at-risk projects before the period closes. That early warning gives project managers and finance teams time to act: adjust crews, negotiate change orders, or revise scope while it still matters.
What data do you need to implement predictive analytics in construction?
The most important inputs are clean, real-time ERP data (job costs, labor hours, billing, subcontractor commitments), project schedule data, and historical project performance records — all flowing through a centralized, standardized data pipeline. Data quality matters more than data volume.
What is the difference between predictive analytics and traditional construction reporting?
Traditional reporting describes what has already happened, often delivered 10–20 days after period close. Predictive analytics uses current and historical data to forecast what is likely to happen next — shifting the finance team from documenting outcomes to preventing unfavorable ones.
How does predictive analytics improve WIP reporting accuracy?
Real-time ERP data keeps percentage-complete calculations and projected costs current, eliminating the lag of manually assembled spreadsheets. Datateer's WIP module automates this entire calculation — over/under-billing positions and projected margin included — turning the WIP schedule from a compliance document into a live management tool.
What are the biggest challenges of implementing predictive analytics in construction?
Poor data quality, inconsistent cost code structures, and siloed systems top the list. These issues must be resolved before predictive models can generate reliable forecasts — which is why a data readiness audit should come before any tool selection.