The gap between when a cost problem develops and when it shows up in a report is where construction firms lose money. And for firms managing multiple concurrent projects, that gap compounds across every active job simultaneously.
Business intelligence in construction addresses this directly. Not as an abstract technology investment, but as a daily operational tool that gives CFOs, controllers, and project finance teams the financial visibility they need to act — not just report. The benefits described below are measurable and operational. They compound the larger and more complex a firm's project portfolio becomes.
Key Takeaways
- Construction BI replaces delayed, manually assembled reports with live financial visibility across all active projects
- The most measurable benefits: faster WIP reporting, elimination of manual data preparation, and early detection of cost overruns before they become unrecoverable
- Firms without BI react to margin problems instead of preventing them, and that reporting burden grows with every project added
- Finance teams that embed BI into daily operations shift from data gatherers to strategic partners
What Is Business Intelligence in Construction?
Construction BI is the process of automatically pulling project and financial data from source systems, consolidating it into a single reliable view, and surfacing that information through dashboards that update from live ERP data — without manual intervention.
In a construction context, that means BI is applied to:
- WIP reporting — percentage complete, overbilling, underbilling, and earned revenue by job
- Job costing and cost-to-complete — actual costs, committed costs, and projected final cost at the phase and cost-code level
- Cash flow forecasting — 13-week liquidity visibility based on real project burn rates
- Labor productivity — crew-level performance against estimated hours
- Subcontractor management — cost tracking, aging, and performance scoring
- Executive portfolio oversight — margin, backlog, and solvency metrics across the entire firm
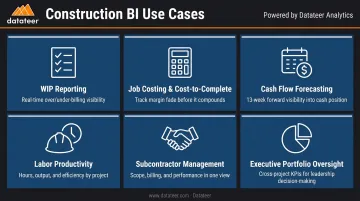
Each of these use cases feeds the same underlying need: giving CFOs, controllers, and project finance teams accurate, current information so they can protect margins and act before problems compound.
The goal isn't dashboards for their own sake. It's confident decision-making backed by data that reflects where jobs actually stand today.
Platforms like Datateer deliver this by integrating directly with construction ERPs — automating data extraction, standardizing cost codes, and eliminating the manual exports that slow reporting down.
Key Benefits of Business Intelligence in Construction
The benefits below focus on measurable, operational outcomes. Each one directly affects the financial health and decision-making speed of a construction firm. They're most pronounced when BI connects directly to the firm's ERP and updates automatically — not when it's populated through spreadsheet exports or manual data entry.
Benefit 1: Real-Time Financial Visibility Across All Active Projects
Construction BI replaces the multi-week lag of traditional WIP reporting with continuously refreshed financial data. Finance managers and executives get an accurate view of cost-to-complete, overbilling, underbilling, and cash position at any point in the reporting period — not just at month-end.
Rather than waiting for end-of-period data pulls and manual reconciliation, BI platforms sync directly with ERP systems to deliver project financials that reflect current conditions. One Double L Management analyst described it this way after implementing Datateer: "The very first time we accessed our data through a Datateer analytics dashboard, that one click replaced two weeks worth of prior work."
Why this matters financially: Delayed visibility is a direct driver of margin loss. By the time a traditional WIP report reflects a problem, it's often too late to course-correct on that project. According to KPMG's 2023 survey of nearly 300 engineering and construction firms, 37% of E&C firms missed budget and/or schedule targets due to lack of effective risk management. Real-time visibility transforms financial oversight from a forensic exercise into an active management tool.
KPIs this benefit directly impacts:
- WIP schedule of values accuracy
- Cost-at-completion variance
- Overbilling and underbilling exposure
- Cash flow position
- Project-level gross margin
When this matters most: Real-time visibility has the highest impact for firms managing multiple concurrent projects — where a CFO cannot reasonably track every job manually — and during high-risk phases like contract closeout, change order periods, or tight cash flow windows.
Benefit 2: Elimination of Manual Reporting and Spreadsheet Dependency
Construction BI automates the data extraction, cleaning, and formatting work that finance teams currently perform by hand. The hours spent on CSV exports, VLOOKUP reconciliation, and spreadsheet assembly get replaced by dashboards that update automatically from source ERP data.
Datateer, for example, connects directly to 20+ construction ERP and project management systems — including Procore, Sage, Viewpoint Vista, and Acumatica. It standardizes cost codes, maps data logic, and delivers clean dashboards with automated overnight data syncing. What previously required weeks of manual effort per WIP cycle is reduced to a single click.
The cost of staying manual: Finance teams using spreadsheets face two compounding problems — time and error risk.
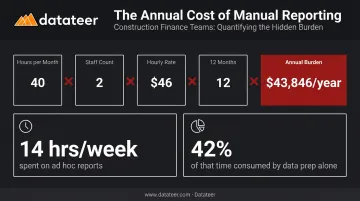
On time: a 2022 Vena survey reported by CFO Dive found that finance teams spend an average of 14 hours per week preparing ad hoc reports, with 42% of that time consumed by data preparation alone. While that figure covers cross-industry finance functions, the pattern is recognizable in construction — where WIP cycles involve reconciling data across project management and accounting systems that don't speak the same language.
On error risk: Panko's spreadsheet error research shows cell error rates commonly in the 1% to 5% range across development experiments. In construction, where a single misallocated cost code can distort job margin across an entire project, that error rate isn't abstract — it's a real liability.
Datateer's Excel Tax Calculator quantifies this burden directly. Using actual inputs — hours per month, staff count, and average salary — it calculates what manual reporting costs annually. A typical scenario: 40 hours/month × 2 staff × $46/hour × 12 months = $43,846 per year in labor cost alone, before accounting for the decisions made on bad data.
KPIs this benefit directly impacts:
- Hours spent on monthly close and WIP report preparation
- Data error rate across reporting cycles
- Number of manual reconciliation steps per period
- Time from period close to distribution
When this matters most: Firms where finance teams spend more time formatting data than analyzing it. Or where the monthly close involves reconciling Procore commits against Sage invoices by hand before every stakeholder meeting.
Benefit 3: Proactive Detection of Cost Overruns and Margin Fade
Construction BI flags labor slippage, budget deviations, and cost-to-complete variances as they develop — not after they've become permanent losses. By continuously comparing actual costs against budget and earned value, BI systems surface early warning signals while there's still time to act.
Datateer's Margin Protection module, for example, monitors original estimated margin against current projected margin per job in real time. It flags specific variance drivers — labor overruns, material price escalation, subcontractor cost increases, and change order denials — at the cost-code and phase level, so finance teams and project managers can investigate the source rather than just observe the result.
Why early detection changes the financial outcome: Margin problems in construction rarely appear suddenly. They develop through small labor inefficiencies, scope creep, and cost code misallocations that go unnoticed in monthly batch reporting. By the time a monthly WIP cycle captures the trend, the project may have weeks or months of field work remaining — or it may already be near closeout.
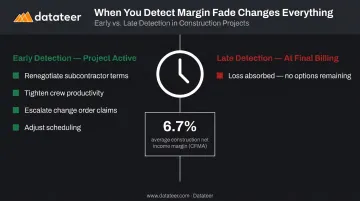
Construction margins leave little room for error. CFMA's 2025 Financial Benchmarker, based on FY2024 data from 1,558 screened construction companies, reported a 6.7% net income before tax margin for all companies. At those margins, a 1-2% cost overrun on a $10M project isn't a rounding error. It's a material hit to annual profitability.
A firm that catches a margin fade on an active project while field crews are still working has options: renegotiate subcontractor terms, tighten crew productivity targets, escalate change order claims, or adjust scheduling. A firm that discovers the same fade at final billing has none of those options.
KPIs this benefit directly impacts:
- Cost variance by project and cost code
- Labor productivity index
- Budget-to-actual by phase
- Cost-at-completion forecast
- Project-level gross margin trend
When this matters most: Fixed-price and lump-sum contracts where overruns can't be passed to the client, long-duration projects where small variances accumulate over months, and firms competing in tight-margin bid environments where every point of gross margin matters.
What Happens When Construction Firms Operate Without BI
When construction firms rely on manual reporting and fragmented data, the downstream problems are predictable — and expensive:
- Finance teams burn hours on exports, reconciliation, and formatting — leaving little room for forecasting or proactive project support. CFMs become data couriers instead of strategic partners.
- Margin problems go undetected until closeout. By the time monthly reporting catches a cost overrun, the project may be complete. The loss gets absorbed, and nothing is learned in time to matter.
- Inconsistent data creates internal friction. When Procore doesn't reconcile with Sage, project managers and finance teams argue about whose numbers are right instead of both working to fix the project.
- Reporting burden scales with project volume. More jobs, more cost codes, more data sources — and without automation, the only fix is more headcount, which compresses margins further.
An Autodesk/FMI study of 3,916 construction stakeholders across 18 countries put a number on it: $1.84 trillion lost globally to bad data in 2020, with $88.69 billion in rework traced directly to poor data quality. Manual, fragmented reporting systems are a primary source of that degradation.
How to Get the Most Value from Construction BI
BI delivers its strongest results when it connects directly to the ERP — not when it's populated from exports or manual feeds. Data in dashboards should reflect current project conditions, not a snapshot from last week. That gap is what separates a real management tool from a more expensive spreadsheet.
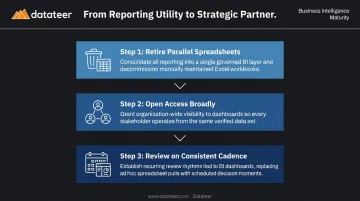
The real value comes when BI becomes the single source of truth across the organization. In practice, that requires three things:
- Retire parallel spreadsheet processes — if the finance team still maintains a separate Excel WIP, the BI platform becomes redundant rather than authoritative
- Open access broadly — project managers, executives, and field leaders referencing the same data replaces finger-pointing with shared accountability
- Review dashboards on a consistent cadence — high-performing construction finance teams monitor leading indicators continuously and bring data-backed recommendations to ownership meetings, not just monthly closes
The shift from reporting utility to strategic partner doesn't happen automatically at implementation. It happens when the finance function stops spending nights on data formatting and starts spending that capacity on the analysis those dashboards make possible.
Conclusion
The core benefits of business intelligence in construction — real-time financial visibility, elimination of manual reporting overhead, and early detection of margin fade — each address a specific failure mode that costs construction firms time, money, and strategic capacity. These aren't abstract capabilities. They surface in reporting cycles, WIP schedules, and project closeouts — where the financial decisions that protect or erode margins actually get made.
These benefits compound over time. As data accumulates, patterns in labor productivity, subcontractor performance, and cost-code behavior become clearer. Forecasts become more reliable. Finance teams become better equipped to advise rather than just report.
BI should be treated as an ongoing operational capability, not a one-time implementation. Firms that embed it into how they manage projects are better positioned to protect margins, scale operations, and navigate the financial complexity of construction. In practice, that means using BI to:
- Monitor leading indicators before problems become losses
- Flag at-risk jobs while there's still time to intervene
- Give field and office teams a shared view of financial reality
Frequently Asked Questions
What are the benefits of using business intelligence?
Business intelligence accelerates reporting, improves decision-making, and gives organizations early visibility into risks before they become losses. In construction specifically, it replaces manual data preparation with automated dashboards — shifting finance teams from data gathering to analysis and turning raw project data into actionable insight.
What are the 4 pillars of business intelligence?
The four core components of BI are data integration, data storage, analytics and reporting, and data visualization. Together, these layers collect raw data from source systems, warehouse it in a clean and structured form, then deliver findings in formats non-technical users can act on — from executives to project managers.
What is one benefit of using AI in construction?
Predictive analytics is among the most practical AI-driven benefits, covering cost-at-completion forecasting, labor productivity trends, and early warning signals on project overruns. AI-assisted BI flags developing variances while field work is still underway, so corrective action happens before monthly reports confirm the damage.
How does BI help with construction cost control?
BI supports cost control by continuously comparing actual project spend against budget at a granular cost-code level. Variances surface in real time so project and finance teams can investigate and respond before overruns compound — replacing the month-end discovery cycle with continuous in-progress oversight.
What construction KPIs should a BI dashboard track?
The most critical construction finance KPIs include WIP schedule of values, cost-to-complete variance, overbilling and underbilling exposure, project gross margin, labor productivity, cash flow position, and budget-to-actual by phase or cost code. Datateer's KPI Library dashboard tracks 50+ of these metrics pulled directly from ERP data, with no manual recreation required.