The result? Fleet reports that arrive weeks late, disconnected from job costs, and too stale to drive corrective action.
This article covers the step-by-step process for optimizing construction fleet performance and reporting—what KPIs to track, how to integrate data sources, how to build dashboards that actually inform decisions, and the mistakes that quietly destroy margins.
Key Takeaways
- Fleet KPIs must connect to project profitability, not just operational benchmarks
- Meaningful reports require integrated data from ERP, telematics, and fuel systems — siloed sources create blind spots
- Reporting lags of 10–20 days are common and preventable — automated, near-daily refresh is the fix
- Integrate equipment costs into job costing and WIP reports — not siloed in a standalone operations tool
- Start with 5–7 core KPIs before expanding — more metrics rarely means better decisions
How to Optimize Construction Fleet Performance & Reporting
Step 1: Define Fleet KPIs Tied to Construction Project Outcomes
Not all fleet KPIs serve construction equally. Generic benchmarks like "total fuel spend" or "fleet age" tell you nothing about whether a specific excavator is eating into a job's margin. Construction KPIs need to map to project profitability, equipment utilization, and cost control.
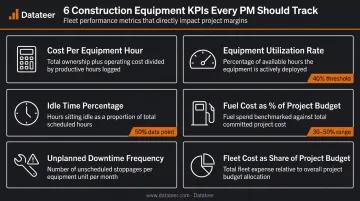
Construction-specific KPIs worth tracking:
- Cost per equipment hour — maintenance, fuel, and repair costs divided by total usage hours
- Equipment utilization rate — active operating time versus available time per job site; assets running below 40% utilization are typically better suited to rental than ownership
- Idle time as a percentage of total hours — data from Teletrac Navman suggests equipment sits idle 50% of the time when data blind spots exist
- Fuel cost as a percentage of project budget — fuel can represent 30–50%+ of a machine's operating cost according to Carolina Cat
- Unplanned downtime frequency — breakdowns per asset per quarter, tracked by job
- Fleet cost as a share of project budget — essential for bid preparation and margin modeling
Before deploying any dashboard, operations, finance, and project management teams need to agree on KPI definitions together. A utilization rate calculated differently by field and finance produces two incompatible numbers and arguments about which one is right—rather than decisions about what to do.
Start with 5–7 core KPIs. Add more only after your team is consistently acting on the initial set.
Step 2: Integrate Your Data Sources
Fleet reports built on a single data source are incomplete. Meaningful fleet reporting pulls from at least three systems:
| Data Source | What It Contributes |
|---|---|
| ERP (Sage, Vista, Acumatica, etc.) | Job cost codes, project budgets, actual cost posting |
| Telematics | GPS location, utilization hours, idle time, speed data |
| Fuel card systems | Fuel consumption per asset, cost per fill, project allocation |
| Maintenance records | Repair history, cost per event, downtime duration |
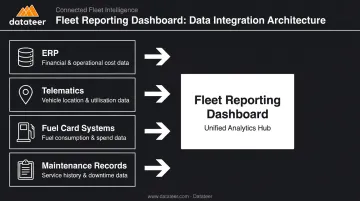
The problem isn't usually a missing system. It's that these systems don't talk to each other. Equipment IDs in telematics don't match asset codes in the ERP. Cost codes in the fuel card system don't align with project codes in Sage. The result is manual reconciliation that introduces errors and delays.
Before integration, verify:
- Equipment IDs are consistent across all source systems
- Cost codes match between ERP and any external data source
- Each system's data refresh frequency meets your reporting cadence
Manual spreadsheet consolidation is where most fleet reporting breaks down at scale. Formula errors, version conflicts, and the time cost of pulling data from four systems every week erode both accuracy and trust in the reports.
Platforms like Datateer connect directly to construction ERPs — Sage 100/300, Viewpoint Vista, Acumatica Construction, Foundation Software, and others — and automate data extraction with built-in cleaning and standardization. The system reconciles cost codes across source systems automatically, so equipment expenses post to the correct project and phase without manual VLOOKUP work.
For telematics and fuel card data not covered by native integrations, CSV uploads can merge manual data feeds with automated ERP extractions in a single dashboard view.
Step 3: Build Real-Time Fleet Performance Dashboards
Static monthly reports are forensic tools. By the time they surface an equipment overrun, the job phase is done and the cost is locked. The goal is dashboards that refresh frequently enough to trigger decisions while there's still room to act.
Core components a construction fleet dashboard should include:
- Equipment utilization summary by job site and asset class
- Idle time breakdown per machine and project
- Maintenance cost trends with unplanned versus scheduled split
- Cost-per-equipment-hour compared to project estimates
- Fleet cost as a percentage of budget-to-actual per job
That timing gap is what drives overruns. CMiC notes that construction overruns stem directly from delayed visibility: teams relying on lagging reports miss the window when corrective action is still possible.
Datateer's Equipment Utilization dashboard, part of the Resource Productivity suite, is available from day one without additional setup. It connects directly to your ERP so equipment costs surface at the job, phase, and cost-code level as an operational detail, not just an aggregate number. Data updates overnight, replacing the typical 10–20 day manual reporting cycle with a near-daily refresh.
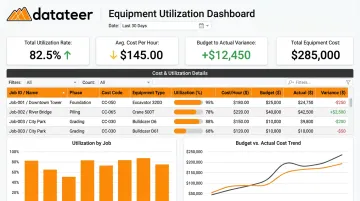
The result: finance and operations see the same numbers at the same time, which eliminates the version-conflict problem that plagues spreadsheet-based reporting.
Step 4: Analyze Reports and Drive Consistent Action
A dashboard that no one reviews on a schedule delivers no value. The final step is building a structured review process with defined owners, cadences, and escalation thresholds.
What a functional fleet review cycle looks like:
- Daily alerts — utilization drops, idle time thresholds exceeded, unexpected downtime events
- Weekly project-level review — equipment cost versus budget by job, maintenance cost trends, reallocation decisions for underutilized assets
- Monthly executive review — fleet cost as a percentage of total project spend, ROI on owned versus rented equipment, cost-per-hour actuals versus estimates
The most important structural rule: fleet findings must connect to financial outcomes. Rising idle time on a job should surface as a cost code variance in the project budget, not remain isolated in a telematics dashboard that only the equipment manager sees.
Datateer's Cost Variance Reporting tracks budget-versus-actual at the job, phase, cost code, and resource type level — equipment included. When an asset's hours spike or fuel costs run over, the variance shows up in the same report where project managers track labor and subcontractor costs. That integration is what converts fleet data from an operational log into a margin protection tool.
Set a specific escalation threshold: if equipment costs exceed budget by more than a defined percentage on a given cost code, it gets flagged for the project manager and finance team that week, not at month-end.
What You Need Before Optimizing Fleet Reporting
Skipping infrastructure preparation leads to dashboards populated with unreliable data. Three areas require attention before any reporting system goes live.
ERP and Systems Requirements
The ERP must be actively coding equipment expenses by project and cost code—not posting fleet costs to a single general expense account. Telematics devices need to be installed and transmitting reliably across the fleet.
A common gap: telematics hardware gets deployed, but the data never flows into financial reporting. Operations can see utilization. Finance sees nothing. That disconnect makes the hardware investment worthless before it starts.
Data Quality and Compatibility
Equipment IDs, cost codes, and project numbers must be consistent across all source systems before building any reports. Mismatched identifiers are the single most common cause of reconciliation errors in construction fleet data pipelines.
Datateer's automated data cleaning engine standardizes cost codes across systems and catches broken or malformed entries before they reach dashboards. This handles most data quality issues automatically during integration—but source systems still need to be capturing equipment costs at the project and cost-code level to begin with.
Stakeholder Alignment
Operations, finance, and project management must agree on three things before dashboards go live:
- KPI definitions — what utilization, idle time, and cost-per-hour mean to each team
- Report ownership — who maintains, reviews, and acts on each dashboard
- Conflict resolution — how discrepancies between systems get adjudicated
A technically functional report that no team trusts delivers zero value. It often creates more conflict than the spreadsheet it replaced.
Key Parameters That Affect Construction Fleet Performance Results
| Parameter | Why It Matters | Risk If Ignored |
|---|---|---|
| Reporting Lag | A 10–20 day lag between activity and report means overruns surface after the project phase ends | Costs lock in before anyone can respond |
| KPI Selection Depth | Surface metrics (total fuel spend) can't drive specific corrective action | Data supports only after-the-fact analysis |
| Data Source Integration | Partial integration (telematics without ERP) shows activity but misses financial context | Manual reconciliation, errors, and slow reports |
| Cost Code Mapping Consistency | Fleet costs must flow to correct project codes to appear in WIP and margin reports | Fleet data stays siloed, never informs job costing |
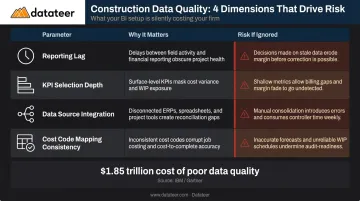
Poor data quality carries a measurable price tag. Autodesk and FMI estimated that it cost the global construction industry $1.85 trillion in 2020—yet only 12% of construction professionals say they always incorporate project data into their decisions.
Reporting lag is the most controllable of these parameters. Whether data reaches decision-makers in hours or weeks determines whether it drives action or only explains failure. Automated overnight refresh closes that gap without manual intervention.
Common Mistakes When Optimizing Construction Fleet Reporting
Tracking too many KPIs without prioritizing. Pulling every available metric from telematics and ERP systems creates noise. If the weekly review covers 25 metrics, no one can identify which three actually need action. Start with 5–7 core KPIs, measure them consistently, and expand only when the team is acting on the current set.
Treating fleet reporting as a standalone operational function. Fleet reports that live only in operations—disconnected from project budgets—are the most common failure mode. Equipment idle time that never surfaces as a cost code variance doesn't protect margins. Fleet data only produces financial value when it feeds directly into job costing, WIP reports, and executive dashboards. Platforms like Datateer connect equipment costs directly to project-level margin tracking and WIP calculations, so rising fleet costs surface where finance teams can act on them.
Relying on manual data pulls and spreadsheet consolidation. Manual processes introduce formula errors, version conflicts, and reconciliation delays that undermine trust in the data. At scale—multiple job sites, dozens of assets, weekly reporting cycles—spreadsheet-based fleet reporting collapses under its own complexity. The cost shows up in both staff time and decision quality.
Failing to establish a reporting cadence and escalation protocol. A dashboard with no defined review schedule and no action thresholds produces no decisions. A functional fleet review cadence includes:
- Daily: Alerts for threshold breaches (idle time, utilization, fuel anomalies)
- Weekly: Project-level reviews for cost trends and reallocation decisions
- Monthly: Executive-level analysis of fleet cost as a percentage of total project spend
Conclusion
Getting fleet performance reporting right comes down to three things: data sources that actually connect, KPIs tied to project financial outcomes, and dashboards that refresh fast enough to drive decisions before costs are locked in.
Most fleet reporting failures trace back to the same few causes: data sources that don't connect, reporting lags that make the data forensic rather than forward-looking, and fleet metrics that never flow into job costing or margin tracking. All of those are infrastructure and process choices — not fixed constraints.
The benchmark worth targeting: fleet cost variances should surface in the same reports where project managers track labor and subcontractors—automatically, at the cost-code level, without manual reconciliation.
Datateer's fleet and cost variance dashboards connect directly to your construction ERP to do exactly that — pulling equipment utilization and cost data into the same reporting layer as labor, subcontractors, and job costing. If your current setup isn't there yet, the 15-Minute Workflow Audit is a quick way to see where the gaps are.
Frequently Asked Questions
How do you measure fleet performance?
Fleet performance is measured through KPIs including equipment utilization rate, cost per equipment hour, fuel efficiency by asset, unplanned downtime frequency, and fleet cost as a percentage of project budget. Effective measurement requires connecting these operational metrics to financial outcomes—utilization data alone, without cost code context, can't drive margin decisions.
What are the 5 pillars of fleet management?
The five pillars are asset acquisition, maintenance management, fuel management, compliance and safety, and reporting and analytics. Reporting ties the other four together—without consistent data aggregation and analysis, the other pillars operate in isolation rather than as a coordinated system.
What KPIs should construction companies track for fleet performance?
Construction-specific KPIs to track: utilization rate by job site, idle time as a percentage of total hours, fleet cost as a share of project budget, unplanned downtime events per asset, and cost-per-hour versus project estimates. Each metric should map to a cost code so variances surface directly in project-level financial reports.
What is the difference between fleet tracking and fleet reporting?
Fleet tracking provides real-time visibility into asset location and operational status via GPS and telematics. Fleet reporting aggregates that data alongside financial and maintenance information to produce KPIs and trends that drive management decisions. Tracking is the raw input; reporting is what makes it financially actionable.
How often should construction fleet performance reports be reviewed?
Daily or near-real-time monitoring for utilization and idle alerts; weekly reviews for cost and maintenance trends at the project level; and monthly reporting for executive-level fleet cost analysis and budget-to-actual comparisons. The cadence should match the pace at which corrective action is still possible on active jobs.
How does ERP integration improve construction fleet reporting?
ERP integration pushes fleet costs directly into project cost codes and WIP reports, cutting reporting lag from weeks to overnight and eliminating manual reconciliation. Datateer connects to Sage, Vista, Acumatica, and other construction ERPs so equipment cost variances appear automatically in job costing and margin reports.