That scenario plays out constantly across construction firms that still depend on manual WIP processes and fragmented data. A Business Analyst at Double L Management described it plainly after switching to automated reporting: "That one click replaced two weeks worth of prior work." Two weeks of lag, every month, while projects drift.
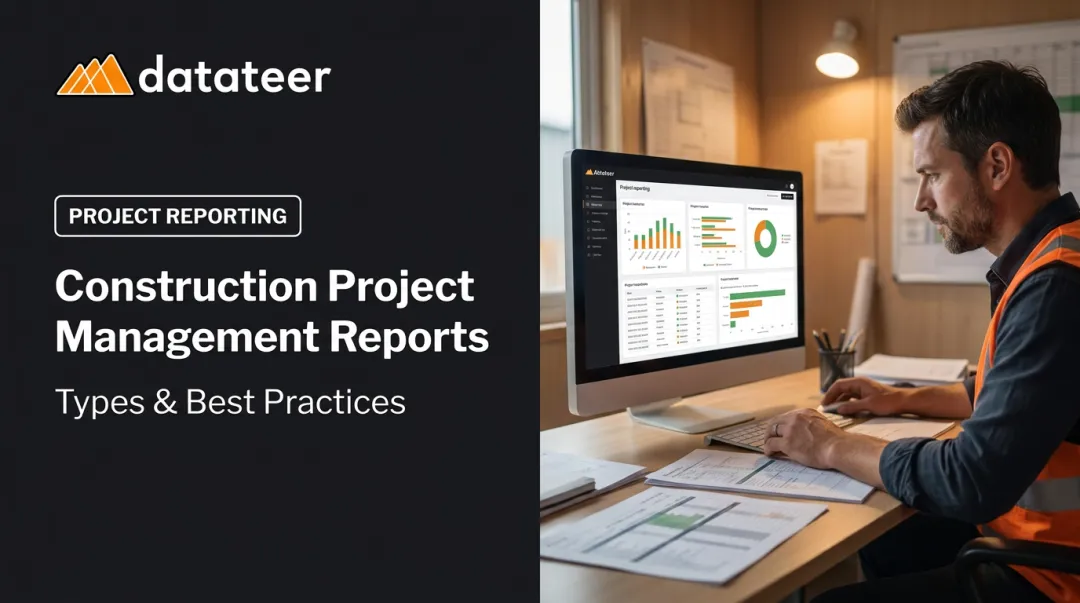
This guide covers what construction reporting actually involves, which report types carry the most financial consequence, best practices for building a reliable reporting operation, the tools modern firms use, and the most common pitfalls to avoid.
It's written for construction CFOs, financial controllers, and accounting teams who need their reporting to be both accurate and timely — not just technically complete.
Key Takeaways
- WIP reports are the financial heartbeat of any construction firm — delays in producing them directly cause unrecoverable margin losses
- Manual Excel-based reporting introduces lag, formula errors, and version control problems — automated ERP-connected tools cut all three
- Bad data cost global construction $1.85 trillion in 2020, making data quality a direct line-item risk, not a back-office concern
- Standardizing cost codes, report formats, and KPI definitions across all projects is what makes portfolio-level visibility possible
- Construction-specific reporting tools — not generic BI platforms — are required to handle job costing, WIP accounting, and retainage correctly
What Is Construction Reporting?
Construction reporting is the systematic process of collecting, analyzing, and presenting project data to monitor financial performance, schedule adherence, resource utilization, and risk exposure across a project's lifecycle.
In practice, it spans everything from a field superintendent's daily log to the WIP schedule a CFO presents to a bonding company.
Why Standard Business Tools Fall Short
Generic reporting tools — Tableau, Power BI, Qlik — weren't built for construction's financial structures. Construction requires data models that horizontal BI platforms don't ship with pre-built:
- Job costing hierarchies tied to cost codes
- Percentage-of-completion revenue recognition
- Retainage tracking across both AR and AP
- Cost code standardization across projects and ERPs
The result: firms that bolt a general BI tool onto their ERP typically spend 12–18 months on custom integrations and dashboards — often $500K+ — before seeing any usable output. Platforms built specifically for construction, like Datateer, skip that build phase by shipping with pre-built construction data models already connected to major ERP systems.
Two Audiences, Two Needs
Construction reports serve two distinct audiences:
- Internal decision-makers (project managers, CFOs, executives) who need operational and financial visibility to act while projects are still in motion
- External stakeholders (owners, lenders, bonding companies) who require formal documentation of project health — WIP schedules, draw request packages, and financial statements that meet surety underwriting standards
Both audiences need accurate data. But internal reports need to be fast; external reports need to be defensible.
Key Types of Construction Reports
Not all construction reports serve the same purpose. A practical way to categorize them: field/operational reports track what's happening on site, while financial/executive reports track the economic consequences of what's happening on site. The financial reports carry the highest stakes when they're delayed or wrong.
Operational Reports
Field-level reports create the daily paper trail that project execution depends on:
- Daily site reports — work performed, labor counts, weather conditions, equipment used. Produced by field leadership every day
- Safety and incident reports — OSHA compliance documentation, near-miss records, incident logs
- Inspection and punch list reports — quality checkpoints, owner walkthroughs, deficiency tracking through to closeout
These reports feed upstream into financial reporting. Labor hours logged in the field eventually become job cost data in the ERP.
Financial and Executive Reports
This is where reporting failures become expensive.
Work-in-Progress (WIP) Reports WIP is the financial heartbeat of a construction firm. It tracks revenue earned versus amounts billed, exposes over-billing and under-billing positions, and gives leadership a real-time view of project-level profitability.
The formula is straightforward: (Percentage of Completion × Contract Price) − Billed Amount. A positive result means overbilling; a negative result means underbilling — which creates cash flow risk and delays revenue recognition.
Bonding companies and lenders examine WIP schedules first. Sureties use them to assess contractor financial health, monitor gross-profit fluctuations, and flag large underbillings before they become a problem.
Job Cost, Profitability, and Estimates vs. Actuals Reports
| Report Type | What It Shows | When to Use It |
|---|---|---|
| Job Cost Report | Actual vs. estimated costs by cost code | Weekly PM reviews |
| Job Profitability Report | Margin analysis per project | Monthly executive review |
| Estimates vs. Actuals | Variance tracking for future bid accuracy | Project closeout |
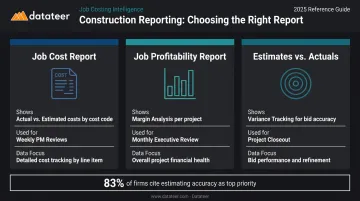
KPMG's 2023 Global Construction Survey found that 83% of respondents named improving estimating accuracy as their single biggest priority — which means estimates vs. actuals reports aren't optional; they're how estimators close the gap between what they bid and what jobs actually cost.
Financial Closeout Reports Closeout reports confirm contractual obligations are met, final costs are reconciled, and the team documents lessons learned. They're the formal record that protects the firm in disputes and builds the historical cost data that sharpens future estimates.
Core Best Practices for Construction Reporting
Standardize Formats and Data Definitions
Inconsistent cost codes across jobs make portfolio-level analysis nearly impossible. When one project codes labor under "01-001" and another uses "LABOR-GEN," there's no clean way to aggregate performance data at the company level.
The fix is establishing a standard chart of accounts and report template library that applies across all projects from day one. Datateer's automated data cleaning engine standardizes cost codes across systems and maps them into a unified structure, even when firms run multiple ERPs simultaneously.
Automate Data Collection at the Source
Manual data entry from field logs or ERP exports into spreadsheets introduces two problems: lag and error. Research from PlanGrid and FMI found construction professionals spend 5.5 hours per week just looking for project data — time that evaporates when direct ERP pipelines replace the copy-paste step entirely.
When apps don't integrate, 49% of companies manually transfer data and 44% use spreadsheets as the transfer mechanism. Each manual handoff is a point where data can break — and often does.
Report at the Right Cadence for Each Audience
Different stakeholders have different decision-making rhythms:
- Daily — field reports (operational, produced by site leadership)
- Weekly — job cost reviews (project manager level, catches variances early)
- Monthly — WIP and financial reports (CFO/executive level, feeds bonding and lender requirements)
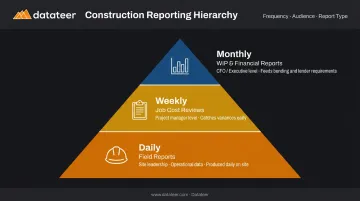
Cadence maps to decision speed. A CFO doesn't need a daily job cost update; a project manager can't wait a month to find out they're over budget on labor.
Build Reports Around Actionable KPIs
Reports that list numbers without flagging variance from plan don't drive decisions. They just create paperwork. Key KPIs worth tracking:
- Cost Performance Index (CPI) — actual work completed relative to actual cost incurred
- Schedule Performance Index (SPI) — actual progress relative to planned progress
- Over/underbilling position — the WIP formula result per project
- Labor productivity — hours per unit against benchmark
- Gross margin percentage — project-level and portfolio-level
Datateer's KPI Library includes 50+ pre-built construction metrics computed directly from ERP data, covering earned value, billing vs. cost, cash conversion, and project margin variance.
Protect Data Integrity and Archive Reports Systematically
The FHWA recommends retaining final project records for 3 years after final payment, with records tied to audit findings kept until the finding is resolved. Bonding companies and lenders rely on this paper trail.
Beyond compliance, archived reports create the historical baseline for better future estimates. Without them, firms are guessing at productivity rates and material costs rather than measuring them.
Common Construction Reporting Challenges
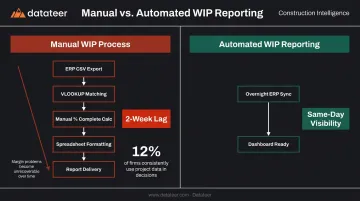
The WIP Lag Problem
Many firms still produce WIP reports through multi-step Excel processes — CSV export from the ERP, VLOOKUP to match billing data, manual percentage-complete calculations, then formatting for presentation. The time cost is real: Datateer's clients report replacing two weeks of manual work with a single click.
The consequence of that lag isn't just inconvenience. Margin problems that could have been corrected mid-project become unrecoverable losses by the time the WIP report surfaces them. Only 12% of construction respondents consistently incorporate project data into decision-making — a stat that explains why margin fade is so common.
The Field-Office Data Disconnect
Project data typically lives in three different places: field activity in a PM platform like Procore, costs in the ERP, and billing in a separate spreadsheet. Finance teams spend hours reconciling these sources instead of analyzing them.
Datateer handles this by automatically reconciling Procore project commits to Sage invoices (or equivalent ERP pairings), giving project managers and finance teams a shared, consistent view of every project without manual cleanup.
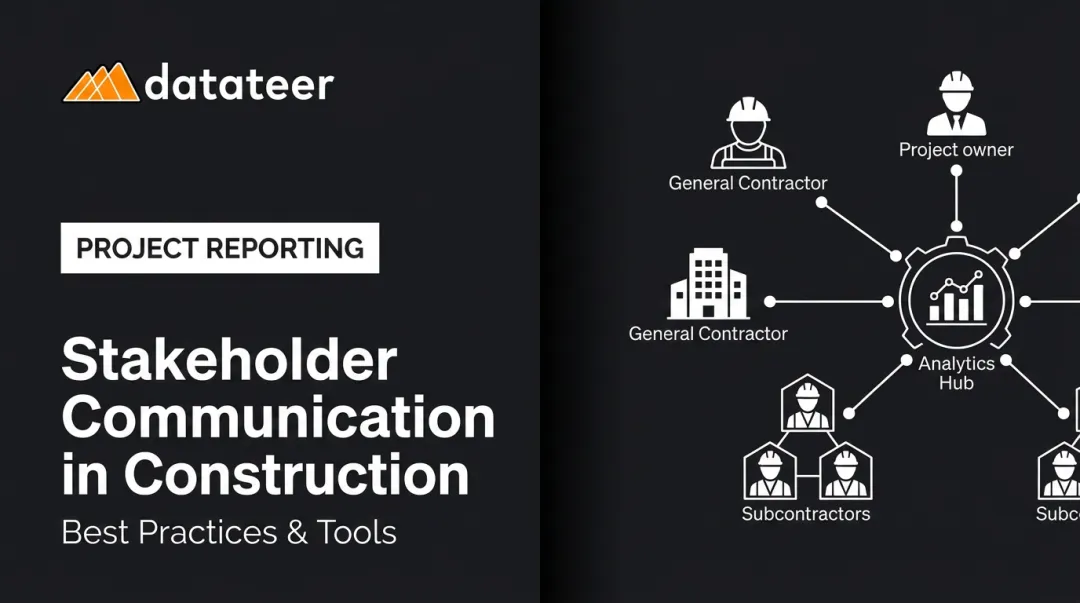
The Stakeholder Communication Problem
Without automated reporting, finance teams manually produce different report formats for different audiences:
- Project managers receive one version
- Executives receive another
- Bonding companies get a third
When reports diverge, version control becomes the liability — two different numbers in circulation means someone is making decisions on wrong data.
Datateer's four dashboard suites (Executive Strategy & Solvency, Financial Operations & Cash Management, Project Excellence & Field Operations, and Resource Productivity) serve each of these audiences from the same underlying data source. Because unlimited users are included in the flat annual price, every stakeholder gets access without triggering additional licensing costs.
Essential Tools and Software for Construction Reporting
Field-Level Reporting Tools
- Procore — field operations, document management, daily logs, RFIs, cost tracking with accounting sync
- Raken — daily reports, time cards, checklists, automated PDF reports with weather data
- Autodesk Construction Cloud — connects field and office with BIM-integrated workflows, RFIs, submittals, and cost insights
These tools capture the operational data that flows upstream into financial reporting.
Scheduling and Schedule Analytics Tools
- Smartsheet — construction project management with mobile field updates and work automation
- Microsoft Project — project reports, burndown charts, timeline views comparing actuals to estimates
- SmartPM — automated schedule reporting from CPM schedules, quality/delay/productivity metrics
Schedule performance directly affects financial outcomes. A project running 40% late is also a cash flow problem.
The ERP as Financial Foundation
The construction ERP — Sage, Vista/Viewpoint, Acumatica, Foundation, CMiC, and others — is the system of record for job costs, billing, and WIP. Sage 300 CRE alone includes 1,400+ prebuilt report formats.
The limitation: ERPs aren't designed to produce executive-ready dashboards. They store and process data; they don't present it. That's why firms need a dedicated reporting layer on top of ERP data.
Datateer: The Financial Intelligence Layer
Datateer connects directly to 20+ major construction ERPs, automatically extracting, cleaning, and mapping cost and billing data into 12 pre-built financial dashboards available on day one. The WIP dashboard alone replaces what many firms describe as a two-week monthly close process with an automated overnight refresh.
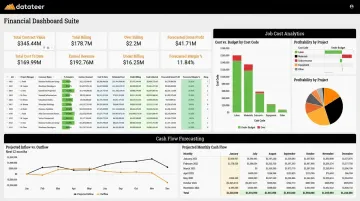
Dashboards cover the full financial picture:
- Automated WIP reports with over/under-billing calculations
- Job cost and cost-to-complete analytics by cost code, phase, and job level
- 13-week cash flow forecasting and AR/AP health dashboards
- PM scorecards, budget vs. actuals, and project cost performance tracking
- 50+ pre-built construction KPIs including CPI, SPI, margin variance, and retainage aging
Pricing is flat annual starting at $10,000 per year per data source, with unlimited users and no per-seat fees. Setup takes 2-4 weeks, and the annual fee starts only when data is flowing.
For firms evaluating their current reporting costs, Datateer's free Excel Tax Calculator shows what the manual spreadsheet process costs annually. Run the numbers: 40 hours/month × 2 staff × $46/hour × 12 months = $43,846 in annual Excel tax, often more than the cost of the platform replacing it.
What to Look for in Any Construction Reporting Tool
Before committing to a platform, evaluate these criteria:
- Direct ERP integration — not manual exports or scheduled file drops
- Real-time or overnight data refresh — not weekly or monthly manual updates
- Pre-built construction-specific templates — WIP, job cost, cash flow, not generic charts
- Role-based access — different views for PMs, CFOs, and executives without extra licensing cost
- Scalability — from single-project to multi-project portfolio view without adding complexity
Frequently Asked Questions
What are reporting tools in project management?
Reporting tools in project management are software platforms that collect, organize, and visualize project data to help teams track performance and communicate status to stakeholders. In construction, they range from field reporting apps like Procore and Raken to financial dashboards like Datateer.
What are 5 project management tools commonly used in construction?
Five widely used tools include: Procore (field operations and document management), Autodesk Construction Cloud (BIM-integrated workflows), Sage/Vista (ERP and job costing), Smartsheet (scheduling and analytics), and Datateer (financial reporting and WIP dashboards). Each addresses a different layer of construction operations — from field documentation to executive-level financial visibility.
What is a WIP report in construction?
A Work-in-Progress (WIP) report tracks the financial status of active projects by comparing revenue earned against amounts billed, revealing over- and under-billing positions. It's also the primary document sureties and lenders use to assess contractor financial health.
How often should construction financial reports be produced?
WIP and job cost reports are typically produced monthly, while daily logs and field reports are produced every day. With automated ERP-connected tools, financial reports can refresh overnight rather than waiting for the traditional monthly close cycle — eliminating the 10–20 day lag that characterizes manual processes.
What is the difference between a job cost report and a WIP report?
A job cost report compares actual costs incurred against the original budget by cost code. A WIP report goes further by incorporating billing data to show the earned revenue position — making WIP the more comprehensive tool for assessing overall project financial health and identifying over/under-billing positions.
Why do construction firms still rely on Excel for reporting?
Excel became the default because ERPs export raw data that requires formatting and manipulation to be readable. But this creates lag, introduces formula errors, and breaks down as project volume grows — which is why more firms are moving to platforms that sync directly with their ERP.