The problem isn't the equipment itself. It's the decisions made before deployment, the data gaps that form in the field, and financial systems that surface cost information too slowly to act on. By the time an overrun appears in a job cost report, it's already compounded across multiple phases.
This article covers how equipment costs accumulate, what drives them, and specific strategies for closing the gaps — organized by the type of change required: decisions, management practices, and surrounding systems.
Key Takeaways
- Equipment costs fall into two categories — ownership (fixed) and operating (variable) — and both must be tracked by job for accurate bids.
- The biggest source of cost overrun is the gap between estimated and actual usage hours — a field data problem, not an accounting failure.
- Internal rental rates built from historical data consistently outperform industry rate manuals for bid accuracy.
- Research from Teletrac Navman found construction equipment is frequently unused 50% of the time due to data blind spots.
- Equipment cost tracking requires alignment across field crews, project managers, and accounting — not just finance.
How Equipment Costs Build Up on Construction Jobs
Equipment costs don't land as a single visible line item. They build across two categories — ownership and operating — and often aren't reconciled to individual jobs until month-end close.
The Compounding Nature of Cost Build-Up
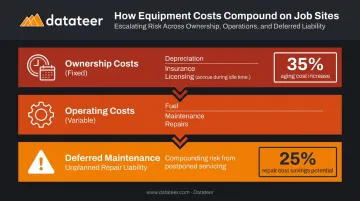
Ownership costs (depreciation, insurance, licensing) accrue whether a machine is running or sitting idle on a job site. Operating costs (fuel, maintenance, repairs) compound on top of that with every hour of use. Deferred maintenance adds a third layer: skipped service creates a future repair liability that rarely appears in the original estimate.
This layering matters because each category behaves differently:
- Idle equipment still generates ownership cost with zero productive output
- Deferred maintenance converts a known PM cost into a larger unplanned repair — Caterpillar notes that regular preventive maintenance can cut equipment repair bills by 25%
- Aging fleets amplify the problem; construction assets more than 10 years old can incur operating costs up to 35% higher per mile than newer equipment
The Visibility Gap
That layered cost structure is only part of the problem. The other half is timing. Field usage data travels through timecards, paper logs, or disconnected apps before it reaches the accounting system. That journey introduces lag stretching weeks — meaning decisions about equipment scheduling, re-estimating, or pulling machines from a job are made on numbers that are already stale.
The practical result: cost overruns that show up at month-end close, long after the window to act has closed.
Key Cost Drivers for Construction Equipment
The Two-Tier Cost Structure
Equipment is harder to price than labor or materials because it carries two distinct cost layers:
| Cost Type | Components | Behavior |
|---|---|---|
| Ownership | Depreciation, insurance, licensing, taxes | Fixed — accrues regardless of use |
| Operating | Fuel, maintenance, repairs, consumables | Variable — scales with hours and intensity |
Most contractors recover one of these consistently. Few track both by job. That gap makes complete job costing structurally impossible, regardless of how well everything else is managed.
The Rate-Setting Gap
Without historical usage data, contractors typically fall back on industry rate manuals — EquipmentWatch, the AED Green Book, or FHWA guidance. These provide a reasonable starting point, but they reflect general market conditions, not the actual cost profile of a specific fleet.
FHWA guidance uses a formula of monthly ownership rate divided by 176 hours plus hourly operating cost. The formula itself is reasonable. The problem is that plugging in industry averages instead of actual fleet data compounds bid error — especially on jobs with long, equipment-intensive phases.
Bottom line: industry rates tell you what a machine costs generically. They don't tell you what your machine costs on your jobs.
Field Data Capture Failure
When workers don't log equipment hours by job and cost code — or log them loosely — cost allocation becomes an estimate rather than a fact. There's no way to compare actual equipment cost against the original bid allowance when the underlying data doesn't exist.
The downstream effects are predictable:
- Over/underbilling on equipment-intensive cost codes
- Inability to identify which job types or equipment types consistently exceed estimates
- Rate-setting that never improves because actuals are never captured cleanly
Two additional factors compound the problem: fleet age and multi-job deployment. Aging machines generate unplanned repair costs that skew actuals, while equipment shared across two active jobs creates allocation ambiguity that's nearly impossible to unwind retroactively.
Cost-Reduction Strategies for Equipment Costs
Equipment cost reduction depends on addressing the right layer. Some problems originate in pre-bid decisions. Others form during execution. Others are structural — embedded in the systems and workflows that equipment data flows through.
Strategies That Change Decisions
Establish Internal Rental Rates from Actual Cost Data
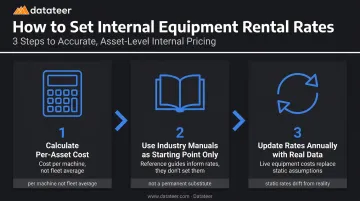
The formula is straightforward: total ownership cost (purchase price divided by useful life, plus annual repair, insurance, and tax estimates) divided by anticipated annual utilization hours. That produces a standard hourly rate per machine.
Three things matter here:
- This calculation must be done per asset, not as a fleet average — an eight-year-old excavator and a two-year-old machine have very different cost profiles
- Industry rate manuals should be a starting point for contractors who lack historical data, not a permanent substitute
- Rates should be updated at least annually as real usage data accumulates — static rates drift from reality
The goal is internal rates that reflect actual fleet performance, not industry averages.
Build Equipment Cost Assumptions Into Bid Templates — and Validate Them
Reusing equipment cost assumptions across bids without checking them against actual historical performance causes systematic underbidding on equipment-heavy work. A contractor who tracked actuals on the last three similar jobs knows whether their assumed hours and rates held up. One who didn't is bidding on faith.
Use Utilization Data to Make Rent-vs-Own Decisions
Tracking actual hours deployed per asset — across jobs, seasons, and project types — gives procurement teams the evidence needed to determine whether owned equipment is earning its keep. This decision is commonly made on gut feel, which often results in underused owned assets creating fixed cost drag that renting would have avoided entirely.
Strategies That Change How Equipment Is Managed
Capture Equipment Hours at the Timecard Level
The most reliable method is the simplest: workers log the job number, cost code, and equipment ID used during each shift, alongside their labor hours. When equipment usage is collected separately from labor timekeeping, it creates a reconciliation problem and a data delay. Combined timecards produce daily, job-level cost allocation automatically.
Track Idle Time as a Distinct Cost Category
Equipment allocated to a job but not actively working still accrues ownership cost. Tracking idle time separately from productive hours gives project managers visibility into whether committed equipment is generating project value — or just generating cost.
Teletrac Navman's 2026 research found that 67% of organizations report assets are often held on-site but unused due to scheduling uncertainty. That's a recoverable cost — but only if it's visible.
Monitor Equipment Cost-to-Budget Performance Continuously, Not at Month-End
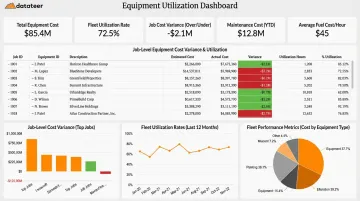
When equipment costs are only reviewed during monthly close, overruns on multi-phase projects compound before anyone can intervene. A variance caught at 20% complete is a conversation. The same variance caught at 80% complete is a loss.
Datateer's Equipment Utilization dashboard — part of the Resource Productivity suite — pulls equipment cost data directly from construction ERPs including Sage, Viewpoint Vista, Procore, and Acumatica, refreshing overnight. Project managers and finance teams access the same live data without per-seat restrictions, so variances surface mid-job rather than at closeout.
Strategies That Change the Context Around Equipment
Standardize Equipment Cost Codes Before Allocating Across Jobs
When different project managers use inconsistent cost codes for the same equipment type, aggregating actual cost data for rate-setting or bidding becomes unreliable. Establishing a standard cost code structure for equipment — by type, not just by individual asset — is a prerequisite for any meaningful cross-job analysis.
Datateer's automated data extraction handles this at the platform level, standardizing cost codes across systems and mapping each firm's unique data logic into a unified structure. That normalization is what makes cross-job equipment cost analysis reliable across your full project portfolio.
Integrate Equipment Cost Capture with the Accounting System
The common failure mode: equipment usage tracked in a separate spreadsheet, manually entered into the accounting system weekly or monthly. That process introduces data latency, reconciliation errors, and a reporting lag that makes real-time visibility impossible.
When equipment data enters the accounting system directly — via integrated mobile timekeeping or ERP-connected field tools — job cost reports update without manual intervention, and entry errors disappear with the manual step.
Schedule Preventive Maintenance Using Usage-Based Triggers
Equipment that receives reactive maintenance — repaired when it breaks rather than before — generates emergency repair costs that are both larger and harder to anticipate. When equipment hours are tracked by asset, maintenance work orders can be triggered automatically based on hours of use.
Fleetio's 2025 fleet data shows that 54.5% of all service activity in construction fleets is scheduled preventive work, with unplanned repairs accounting for 39.3%. The gap between those two numbers is where preventive programs create direct cost savings.
Conclusion
Equipment cost overruns are predictable, not inevitable. They're the result of rate-setting without data, field reporting without discipline, and financial systems that surface information too late to be useful.
The contractors who protect margins on equipment-intensive jobs close these gaps at three levels: the decisions made before deployment, the data flows during execution, and the systems that connect field activity to financial visibility.
The third level is where most firms have the most room to improve. Historical data only makes bids more accurate if tracking discipline is applied on every active job — and that data has to be visible in time to change outcomes, not just explain them after close.
For construction finance teams ready to move from forensic reporting to forward-looking visibility, Datateer's equipment utilization and cost variance dashboards connect directly to your ERP, giving you a real-time view of fleet performance across every active job. If you want to see where your current data workflow stands, the free 15-Minute Workflow Audit is a fast way to identify the gaps.
Frequently Asked Questions
What is an internal equipment rental rate in construction?
An internal rental rate is the per-hour cost assigned to a piece of equipment for job costing purposes. It's calculated by dividing total ownership and estimated annual operating costs by anticipated annual utilization hours, giving estimators a consistent rate to apply across bids.
What costs should be included in construction equipment cost tracking?
Both ownership costs (depreciation, insurance, taxes, licensing) and operating costs (fuel, maintenance, repairs, consumables) must be captured. Tracking only one category produces incomplete job costing and bids that consistently miss the mark.
How does equipment cost tracking improve construction bids?
Historical equipment cost data by job type lets estimators verify whether assumed rates and hours actually matched field reality. That closes the gap between industry average rates — which reflect general conditions — and actual fleet performance on specific project types.
What is the difference between equipment ownership costs and operating costs?
Ownership costs are relatively fixed and accrue whether or not equipment is actively used: depreciation, insurance, and licensing don't stop when a machine sits idle. Operating costs vary with usage intensity: fuel, maintenance, and repairs increase with hours worked. Both categories must be recovered in the job's equipment allowance to avoid margin erosion.
How do construction companies typically track equipment hours on job sites?
The most accurate method is embedding equipment usage into labor timecards — workers log job number, cost code, and equipment ID each shift. Other methods include separate daily equipment logs and mobile field tracking tools, though accuracy drops as the capture point moves further from the actual work.
What happens when equipment costs are not tracked by job?
Unallocated equipment costs get absorbed into overhead or lost entirely. Without job-level tracking, there's no way to measure true job profitability, identify which project types erode margins on equipment, or build reliable internal rental rates for future bids.