Introduction
Most construction finance teams are running Sage for accounting, Procore for project management, a separate payroll platform, and a web of Excel files holding everything together with brittle formulas. The financial picture only comes together once someone spends two weeks assembling it, by which time margin decisions have already been made on guesswork.
That's the reality for most CFOs and Controllers right now. WIP reports take 10–20 days to produce. Job cost data reflects conditions from three weeks ago. Change orders are logged in one system, costs tracked in another, with no clean way to reconcile them.
This guide covers why financial data integration in construction is harder than it looks, what high-performing firms do differently, and how to move from siloed, stale data to a connected financial operating system that actually supports decisions.
Key Takeaways
- Financial data integration means automated flow from ERP, project management, and field systems — not manual spreadsheet exports
- The biggest integration failures start with inconsistent cost codes, poor governance, and batch-export architectures
- Standardizing data mapping before building any pipeline is the step most firms skip
- Automated overnight sync is what separates firms that catch margin fade early from those that find overruns at project close
- Successful integration requires the right architecture and clear data ownership across finance, operations, and field teams
What Is Financial Data Integration in Construction?
Financial data integration is the process of connecting every system that generates financial or operational data — your ERP, project management platform, payroll system, estimating tools, and field apps — so data flows automatically into a unified environment where it can be reported on without manual assembly.
Exporting a report from Sage and pasting it into Excel is not integration. True integration means automated, validated, consistent data movement where field costs and back-office figures reconcile without anyone intervening. The difference matters because manual processes break under deadline pressure — and in construction, deadline pressure is constant.
Why Construction Makes This Harder
Construction finance isn't general business accounting. Several reporting requirements demand data from multiple systems to be accurate simultaneously:
- Job-level cost tracking
- Percentage-of-completion revenue recognition
- WIP schedules
- Retainage management
Per AICPA/CIMA guidance on WIP accounting, WIP schedules enable revenue recognition and provide one of the most precise indicators of construction financial performance. But an accurate WIP schedule requires cost actuals from the field, billing data from the ERP, and committed costs from project management — simultaneously. No single system holds all of that. That's what makes integration harder here than in most industries — and what makes getting it right so consequential.
Why Construction Financial Data Integration Is Uniquely Challenging
The Fragmented Tech Stack
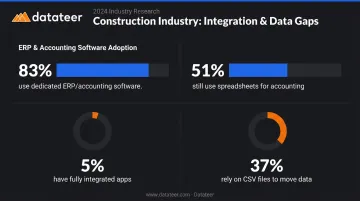
Most construction firms run 3–6 different software systems with no native connection between them. According to the 9th Annual Construction Technology Report, 22% of construction firms used six or more mobile apps for daily work, while only 5% had all their apps fully integrated. Meanwhile, 27% had no app integration at all — with 37% relying on CSV files to move data between systems.
The same report found that 83% of firms used dedicated accounting or ERP software, yet 51% still used spreadsheets for accounting workflows. The tooling is there. Connecting it remains the unsolved problem.
Cost Code Chaos
Cost codes are the backbone of job-level financial tracking, and they're almost never standardized across systems. One platform might call an expense "Trade Labor – Electrical," another lists it as "Subcontractor – Electrical," and the ERP uses a numeric code with no description attached.
Without a mapping layer to reconcile these differences, consolidated reporting becomes either impossible or requires hours of manual translation per reporting cycle. That translation gap is a direct cause of unreliable job cost data.
The Data Quality Problem at Scale
Research from Autodesk and FMI estimated that bad data — defined as inaccurate, incomplete, inaccessible, inconsistent, or untimely information — cost the global construction industry $1.85 trillion in 2020, with decisions made using bad data driving $88.69 billion in rework alone.
Separately, Autodesk/Deloitte research found that 86% of construction companies collected financial data, but only 33% analyzed and used it for decisions. Collecting data and acting on it are two very different capabilities — and most firms have only built the first one.
The Governance Gap
Those trillion-dollar losses trace back to a root cause most firms overlook: no one owns the data. Finance waits on the field to log actuals. Project managers wait on accounting to close purchase orders. Leadership waits on everyone.
Without clear accountability for who enters, validates, and maintains data in each system, integration pipelines don't solve the problem — they just move bad data faster.
Best Practices for Financial Data Integration in Construction
Standardize Cost Codes and Data Logic Before You Integrate
Integration amplifies whatever data quality already exists. Connecting inconsistent systems just moves the inconsistency downstream faster. The most important pre-integration step is creating a universal cost code mapping that translates each source system's language into a consistent schema.
Practical steps:
- Audit cost codes across all systems — document every cost category in every platform and identify where the same cost is named differently
- Define canonical categories — establish master cost buckets (labor, materials, subcontract, equipment, overhead) that every system maps to
- Document transformation rules — record exactly which code in each source system maps to which canonical category (e.g., "Procore cost type X = ERP cost code Y")
- Embed the mapping in the pipeline — transformation rules should be enforced programmatically, not by memory
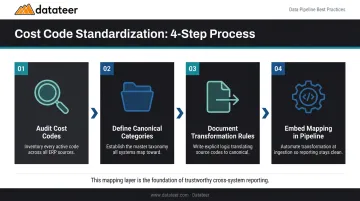
This mapping layer is what makes cross-system reporting trustworthy. Without it, every downstream report inherits the same inconsistency you were trying to fix.
Datateer's automated data cleaning engine handles this process by standardizing cost codes across systems, catching broken or malformed entries, and mapping each firm's data logic into a unified structure — so the reconciliation work happens automatically rather than before every reporting cycle.
Establish a Single Source of Truth with Direct ERP Sync
A single source of truth means a centralized data layer — whether a cloud data warehouse, a purpose-built analytics platform, or an integrated ERP module — where every financial figure traces back to the authoritative source system without manual reentry.
The critical word is "direct." Truth only applies if the sync connects straight to the source. Filter it through a spreadsheet intermediary and you've introduced a point of failure at the worst possible step.
The shadow spreadsheet problem: Even when an integration exists, finance teams often maintain parallel Excel files because they don't fully trust the system. This creates two versions of the financial picture and defeats the purpose entirely. Real adoption requires that the central source is both accurate and easy enough to access that no one needs a backup.
Datateer's direct ERP sync pulls data from 12 major construction platforms, including:
- Procore, Sage 100/300/Intacct, Viewpoint Vista, Viewpoint Spectrum
- Acumatica, Foundation Software, CMiC, Jonas, QuickBooks, and NetSuite
Automated cleaning and standardization reconciles Procore project commits to Sage invoices without manual VLOOKUP work — no scrambling to align figures before board meetings.
Automate Data Extraction and Transformation
Manual ETL (extract, transform, load) processes are the most common integration failure point. They rely on people to remember to run exports, check for errors, and apply consistent transformation logic — tasks that get skipped under deadline pressure. Automated pipelines remove that dependency entirely.
That's where the transformation layer earns its keep. Raw ERP data is rarely report-ready. Vendor names are inconsistent, job codes need cross-referencing, committed costs need separation from actuals, and retainage needs to be broken out. A well-designed transformation layer handles all of this programmatically, so every downstream report reflects the same logic every time.
Datateer supports CSV uploads alongside automated ERP feeds for scenarios where some data lives outside the primary ERP — manual field logs, for example — merging both sources into the same reporting environment.
Build for Automated Daily Refresh, Not Periodic Batch Exports
Batch export systems collect data at set intervals — nightly, weekly, or at month-end. Automated daily sync updates data every night at minimum, with more frequent options available when needed. For construction finance, this distinction determines whether you catch a cost overrun while there's still budget to act, or discover it at job close.
The practical benchmark here: replacing a 10–20 day WIP report lag with automated overnight refresh changes what decisions are actually possible. Datateer's standard configuration syncs data overnight, with dashboard access that's instant once data is loaded — and more frequent refresh options available for firms that need it.
Not every data point needs the same cadence, but these categories should update at least daily:
- Committed costs and purchase orders
- Labor entries and time logs
- Change orders (approved and pending)
- Billings and retainage updates
WIP schedules are commonly updated monthly per AICPA/CIMA standards, but the underlying cost and billing data feeding the WIP calculation should be current, not a week old.
Define Data Ownership and Governance Across Teams
The most sophisticated integration architecture produces unreliable reports if no one owns the quality of the data flowing through it. Construction firms need explicit data stewardship roles assigned — not assumed.
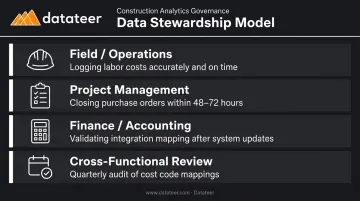
A lightweight governance model for mid-size firms:
- Field/operations: Responsible for logging labor costs accurately and on time
- Project management: Responsible for closing out purchase orders within a defined timeframe (48–72 hours is a common benchmark)
- Finance/accounting: Responsible for validating that integration mapping is still accurate after any system update
- Cross-functional review: Quarterly audit of cost code mappings and transformation rules to catch drift after software updates
Datateer's automated engine catches broken or malformed entries as part of the data pipeline, which provides a technical backstop — but governance still requires human accountability for what gets entered in the first place.
How to Select the Right Integration Architecture
Three approaches dominate construction integration decisions, each with meaningful trade-offs:
| Approach | What It Is | Trade-Offs |
|---|---|---|
| Native ERP integrations | Modules built into source systems | Limited scope; only connects what the vendor supports |
| Middleware/iPaaS | Tools like Zapier or Boomi connecting specific fields between platforms | Requires ongoing maintenance; limited construction-specific logic |
| Purpose-built analytics platforms | Full ERP-to-dashboard pipeline with construction-specific data models | Most complete solution; requires selecting a vendor with deep ERP compatibility |
What to Evaluate When Choosing
Before locking in an approach, ask these questions:
- Does the integration cover all source systems, or just the primary ERP?
- Does it handle data transformation logic, or just move raw data?
- Does it support automated daily refresh, or batch exports only?
- Can non-technical finance users access and trust the outputs without IT involvement?
Generic middleware tools like Zapier can connect two systems for simple field-to-field transfers, but they don't understand construction data models. They can't reconcile Procore commits to Sage invoices or apply percentage-of-completion logic. Platforms built specifically for construction — like Datateer — arrive with those data models and KPIs already mapped, so your team isn't starting from a blank slate or waiting on custom development.
Scalability Criteria to Assess Before You Commit
A firm growing from 5 to 50 active projects needs architecture that doesn't require manual reconfiguration every time a new job starts. If adding a project means filing an IT ticket, the system becomes a bottleneck — not an asset.
When evaluating scalability, look for these signals:
- New projects flow in automatically from the ERP without manual setup
- Additional users can access dashboards without per-seat license negotiations
- Historical data stays intact as the project count grows
- The vendor's roadmap shows continued investment, not a static feature set
The difference matters most during growth spurts. An architecture that works at 10 projects but breaks at 40 forces a costly mid-stride migration — exactly when the finance team has the least bandwidth for it.
Turning Integrated Financial Data Into Actionable Dashboards
A well-integrated data layer that requires SQL queries to access doesn't help a CFO running Monday morning operations reviews. The value of integration is realized only when connected data becomes role-appropriate views that people can actually use.
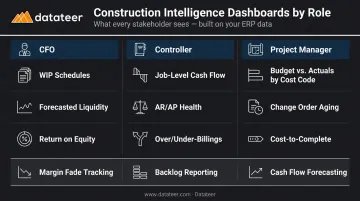
The goal of integration is decision-making, which requires translating connected data into role-appropriate views:
- CFO: WIP schedules, forecasted liquidity, return on equity
- Controller: Job-level cash flow, AR/AP health, over/under-billings
- Project Manager: Budget vs. actuals by cost code, change order aging, cost-to-complete
What Construction Dashboards Need That Generic BI Tools Miss
Generic BI platforms require finance teams to build construction logic from scratch — percentage-of-completion calculations, overbilling/underbilling flags, margin fade tracking, retainage schedules. That's a multi-month development project with ongoing maintenance.
Construction-specific dashboards should surface:
- Job-level profitability with over/under billing calculations baked in
- Margin fade tracking by phase, not just at the job level
- Labor productivity ratios against budget (hours and cost)
- Backlog reporting tied to revenue recognition
- Change order impact and aging — pending, approved, and disputed
- Cash flow forecasting at the project and company level
Per CFMA's 2025 Financial Benchmarker, Best in Class contractors achieved 12.0% net income before taxes — nearly double the industry average of 6.7%. That spread is where dashboards earn their keep: catching slippage while a project can still be corrected, not at close.
Datateer's Day-One Dashboard Suite
Datateer delivers 12 pre-built construction dashboards on day one, organized across four suites:
- Executive Strategy & Solvency: Return on Assets/Equity/Revenue, Forecasted Liquidity, Cash Conversion & Velocity
- Financial Operations & Cash Management: AR & AP Health, WIP & Financial Truth, Job-Level Cash Flow
- Project Excellence & Field Operations: Project Cost Performance, Budget vs. Actuals, PM Scorecards
- Resource Productivity: Labor & Materials Productivity, Subcontractor Performance, Equipment Utilization
All 12 are included at the base price — no module fees, no per-seat licensing. Setup takes 2–4 weeks, with annual fees starting after data is live. Pricing starts at $10,000/year per data source, with unlimited users included.
Frequently Asked Questions
What is financial data integration?
Financial data integration is the process of automatically connecting disparate systems — ERPs, project management tools, payroll platforms — into a unified data environment. Information flows between systems without manual export and reentry, producing consistent, up-to-date financial reports without manual spreadsheet work.
What are the accounting methods for construction projects?
The two primary methods are percentage-of-completion, where revenue is recognized proportional to project progress, and completed contract, where revenue is recognized only at project close. Your integration layer must accurately capture costs and billings across systems to support whichever method your firm uses.
Which data integration tools are best for construction?
The right tool depends on your ERP stack and internal technical resources. iPaaS middleware handles simple connections; cloud data warehouses suit engineering-led teams; purpose-built platforms like Datateer manage the full ERP-to-dashboard pipeline without requiring internal data engineers.
How do you standardize cost codes across multiple construction ERPs?
Start by auditing cost codes in each source system, then build a master mapping table that translates them into a canonical set of categories. That mapping logic lives in the transformation layer, so every report reflects consistent categories regardless of where the raw data originated.
How long does it take to implement financial data integration?
Timelines vary by approach. Custom in-house builds typically run 3–6 months or more. Purpose-built platforms with pre-built ERP connectors — such as those integrating with Sage, Procore, Vista, or Acumatica — can have data flowing within 2–4 weeks, making platform selection the biggest variable in how fast you see results.
What is the difference between ERP integration and a data warehouse for construction?
ERP integration connects two specific systems — for example, Procore and Sage. A data warehouse is a centralized repository that pulls from all systems, stores historical data, and supports cross-project analytics. Most effective construction finance setups use both: direct integrations feeding into a purpose-built data layer.