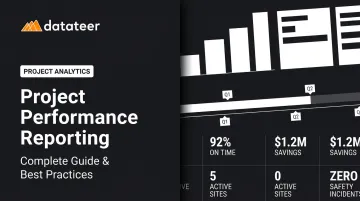
The gap between raw job cost data and executive decisions is where margins disappear. According to a 2023 KPMG Global Construction Survey, only 50% of project owners reported their projects completing on time, and 37% missed budget or schedule targets by 20% or more. That's not a project execution problem — it's a reporting and visibility problem.
This guide is written for construction CFOs, finance managers, and CPAs serving construction clients. It covers what project performance reporting is, why it's uniquely high-stakes in construction, which report types to use and when, what KPIs actually matter, and how to build a system that delivers real-time visibility — not monthly forensic summaries.
Key Takeaways
- Project performance reporting measures actual progress against planned baselines — covering cost, schedule, scope, and quality — and translates that data into decisions.
- In construction, it's the mechanism that surfaces job cost overruns, labor slippage, over/under billing, and margin fade before they become unrecoverable losses.
- Core report types: status reports, WIP schedules, variance reports, earned value reports, and forecasting reports, each serving a different audience and decision layer.
- Watch these KPIs: CPI, SPI, over/under billing position, labor productivity rate, and projected margin at completion.
- Best practice: automated reporting connected directly to your ERP, not a monthly spreadsheet delivering data that's already 10–20 days old.
What Is Project Performance Reporting?
Project performance reporting is the systematic process of measuring a project's actual progress against an established baseline — covering cost, schedule, scope, and quality — then communicating those findings to the people responsible for project decisions.
The outcome it's designed to produce: a clear, quantified view of whether a project will deliver its planned margin, on time and within budget, with problems flagged early enough to act on them.
How It Differs from a Status Update
Most teams conflate the two. A narrative update — "we poured the foundation this week and subcontractors are on schedule" — describes activity. Performance reporting quantifies variance against a baseline.
Real performance reporting requires:
- A documented baseline (original budget, schedule, scope)
- Quantified metrics comparing actuals to that baseline
- Forward-looking forecasts, not just backward-looking summaries
Without a baseline to compare against, a report can only describe what happened — not whether it signals a margin problem or a schedule drift that's still recoverable.
Why Project Performance Reporting Is Critical in Construction
Construction has financial characteristics that make reporting failures genuinely dangerous — not just inconvenient.
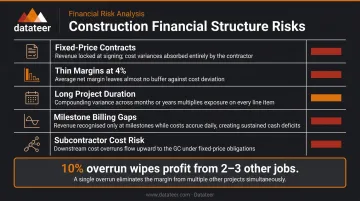
The Financial Structure of Construction
- Fixed-price contracts mean cost overruns come directly out of the contractor's margin, not the owner's pocket.
- Thin margins — FMI reports an average operating profit margin of 4% for self-performing contractors, with CFMA's 2024 data showing Industrial and Nonresidential contractors averaging 4.1% net income before taxes.
- Long project durations mean a variance that appears small in month two can compound into a significant loss by month twelve.
- Milestone billing cycles create cash flow timing gaps that can mask underlying margin erosion.
- Complex subcontractor chains add layers of cost risk that don't always surface cleanly in job cost reports.
At 4% margins, a single project that runs 10% over budget doesn't just underperform — it can wipe out the profit from two or three other jobs.
The WIP Reporting Lag Problem
In most construction firms, WIP schedules are still assembled manually at month-end: someone exports data from the ERP, reconciles it with spreadsheets, maps cost codes, and formats the report. By the time the CFO reviews it, the data can be 10–20 days old.
By then, the conditions that created the variance — labor running over, a subcontractor billing ahead of work completed — have already compounded. Corrective action becomes reactive, not preventive.
What Goes Wrong Without Structured Reporting
- Margin fade goes undetected until project close-out, when nothing can be done to recover it
- Overbilling creates a balance sheet liability (billings in excess of costs) under ASC 606
- Underbilling creates cash flow stress and understates receivables
- Labor slippage compounds week over week into significant overruns
The consequences extend beyond individual projects. NASBP guidance requires contractors to prepare a quarterly schedule of work in progress for surety bonding — including contract price, costs incurred, estimated cost to complete, and amounts billed. Stale or inaccurate WIP reporting puts bonding capacity and credit lines at risk, not just project margins.
Types of Project Performance Reports Used in Construction
The right report depends on the audience and the decision being made. Executives need rolled-up margin summaries. Project managers need job-level cost detail. Lenders need formal WIP schedules. A single generic report serves none of these audiences well.
Status Report
The most common performance report. It provides a snapshot of overall project health against baseline — covering schedule, cost, scope, and key issues. Used in executive briefings, owner communication, and stakeholder alignment.
It answers one question: where are we versus where we planned to be?
WIP Schedule Report
A construction-specific financial report tracking revenue earned vs. revenue billed vs. costs incurred across all active projects. It surfaces two critical conditions:
- Overbilling (billing ahead of earned value) — creates a contract liability on the balance sheet under ASC 606, which must be repaid through future performance
- Underbilling (billing behind earned value) — signals cash flow risk and understates receivables
AICPA describes WIP schedules as enabling revenue recognition under the percentage-of-completion method and providing a more precise indicator of financial performance than simple billing activity. Sureties rely heavily on WIP schedules when evaluating bond capacity.
Variance Report
Where WIP tracks billing position, variance reports measure execution. They quantify the gap between planned and actual performance on cost and schedule. The two core measures:
- Cost Variance (CV) = Earned Value − Actual Cost
- Schedule Variance (SV) = Earned Value − Planned Value
Negative variance triggers investigation. Most firms set thresholds (a variance beyond 5% or 10% of budget, for example) that automatically require a corrective action plan from the project manager.
Earned Value Report
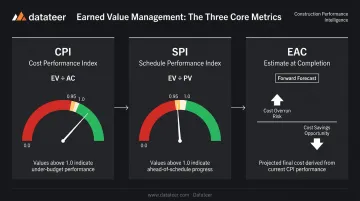
Earned Value Management (EVM) integrates cost, schedule, and scope into a single composite view using two indices:
- CPI (Cost Performance Index) = EV ÷ AC
- SPI (Schedule Performance Index) = EV ÷ PV
Per DOE's EVM framework, a value below 1.0 on either index indicates unfavorable performance, and a reading below 0.95 is an early-warning signal requiring attention.
EVM also provides the basis for Estimate at Completion (EAC) forecasting, which projects final cost based on current performance trajectory.
Forecasting Report
The most forward-looking report type. It projects final cost at completion and estimated completion date based on current performance trends. It's the report most directly tied to margin protection — if current trends hold, will this job finish in the black or the red?
Key Metrics and KPIs for Construction Project Performance
Cost Performance Index (CPI)
Formula: CPI = Earned Value ÷ Actual Cost
A CPI below 1.0 means the project is spending more than it has earned. A CPI of 0.90 means for every $1.00 spent, only $0.90 of work has been completed. In construction's thin-margin environment, a CPI that drifts from 1.0 to 0.92 on a $5M project represents a material overrun.
Schedule Performance Index (SPI)
Formula: SPI = Earned Value ÷ Planned Value
An SPI below 1.0 means the project is behind planned pace. In construction, schedule delays carry direct financial consequences — extended general conditions, delayed billing milestones, and potential liquidated damages make SPI a financial metric, not just a scheduling one.
Over/Under Billing Position
The gap between revenue earned (based on percent complete) and revenue billed. This KPI has no equivalent in generic PM frameworks — it's uniquely critical to construction finance.
- Persistent underbilling → receivables and cash flow problem
- Persistent overbilling → balance sheet liability that must be settled through future project performance
Labor Productivity Rate
Actual labor hours versus budgeted hours per unit of completed work. It's the earliest warning sign of margin fade — visible weeks before cost overruns reach the financials.
By the time a labor cost overrun shows up in the financials, the inefficiency has been compounding for weeks. FMI's 2023 Labor Productivity Study found that 79% of contractors could improve labor productivity by 6% or more with better management — and a 6% productivity gain produces a 50% average increase in profitability.
Track this weekly, not monthly.
Projected Margin at Completion
The forecasted profit margin the project will deliver based on current performance. It combines cost-to-complete estimates with remaining billings to project whether the job will deliver, erode, or exceed its original margin target. This is the KPI that should drive executive attention on any active project — not just at month-end, but whenever cost or schedule signals shift.
How to Build an Effective Project Performance Reporting System
Step 1: Establish Reporting Cadence and Data Ownership
Define who collects what, at what frequency, and to what accuracy standard:
- Weekly — field cost reporting against cost codes; labor hours by crew and phase
- Biweekly — percent-complete updates from project managers
- Monthly — WIP schedule close with finance; variance review with executive team
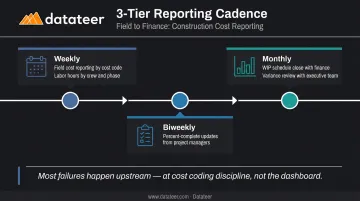
Most reporting systems fail upstream, not at the report level. Inconsistent cost coding discipline — not the dashboard — is where accuracy breaks down.
Step 2: Connect Reporting to a Single Source of Truth
Manual spreadsheet assembly introduces two risks: lag and error. By the time a manually assembled WIP schedule reaches the CFO, the data is already 10–20 days old — before accounting for formula breaks or reconciliation errors.
The solution is direct ERP integration. Reporting systems that pull cost, billing, and labor data automatically from the ERP — rather than waiting for someone to export and format it — eliminate both the lag and the error risk.
One example of this approach is Datateer, which syncs overnight from 12+ construction ERPs and delivers WIP schedules, cost variance reports, and margin dashboards that refresh automatically. Implementation runs 2–4 weeks, with the full dashboard suite live on day one — no manual build required each month.
Step 3: Tailor Reports to the Audience
| Audience | What They Need |
|---|---|
| Field supervisors | Job cost detail by cost code and trade |
| Project managers | Job-level variance, schedule status, cost-to-complete |
| CFO / Controller | Portfolio margin summary, WIP position, cash flow |
| Lenders / Sureties | Formal WIP schedule in standard format |
| Executive team | Rolled-up margin trends, at-risk projects flagged |
A single generic report distributed to all of these stakeholders serves none of them. The reporting system should deliver the right view to the right audience — automatically.
Common Mistakes in Construction Project Performance Reporting
Mistaking Narrative Updates for Performance Reports
Describing what was accomplished last week is activity tracking, not performance reporting. Real performance reporting requires a documented baseline — original budget, schedule, scope — to compare against. Without that baseline, you can describe activity but you cannot assess performance.
Reporting from Stale or Manually Assembled Data
This is the most dangerous reporting failure in construction. A WIP schedule built from spreadsheets that are two to three weeks out of date will show a margin problem that has already compounded beyond the corrective window.
Datateer describes this as "forensic accounting mode" — teams performing autopsies on problems rather than preventing them. Moving from monthly manual WIP builds to automated real-time data is where most construction finance teams recover the most ground, fastest.
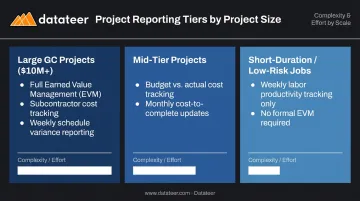
Treating All Project Types the Same
A $50M general contractor project with complex subcontractor scopes requires different KPI depth and report frequency than a $500K specialty subcontract. One-size-fits-all templates either overwhelm short-duration jobs with unnecessary overhead or under-report the complexity of large, high-risk projects.
Calibrate reporting to project size, contract type, and margin risk:
- Large GC projects ($10M+): full EVM, subcontractor cost tracking, and weekly schedule variance
- Mid-tier projects: budget vs. actual with monthly cost-to-complete updates
- Short-duration or low-margin-risk jobs: weekly labor productivity, not formal earned value analysis
Conclusion
Project performance reporting transforms raw job cost data into financial insight that drives real decisions. In construction, the gap between intuition-based management and data-driven management shows up directly in margin outcomes.
Generic PM frameworks don't account for WIP schedules, over/under billing, retainage, or bonding requirements. Construction finance teams need reporting built around the actual structure of construction contracts and cash flows, not adapted from software development or generic project management templates.
The goal is producing the right reports — accurate, timely, and delivered to the right people at the right frequency — so decisions get made while there's still time to act on them.
If your current WIP process is a monthly manual build, that reporting gap is costing you margin visibility. Datateer's free 15-Minute Workflow Audit shows what automated construction reporting looks like against your actual data — no slides, no pitch.
Frequently Asked Questions
What is performance reporting in project management?
Performance reporting is the process of collecting and analyzing project data — cost, schedule, scope, and quality — and communicating that information to stakeholders to support decision-making. It tracks actual progress against a planned baseline to surface variances before they become unrecoverable.
What are the 5 key performance indicators in project management?
Common PM KPIs include scope variance, schedule variance, cost variance, CPI, and SPI. In construction, these are complemented by construction-specific metrics: over/under billing position, labor productivity rate, and projected margin at completion.
What is the 50/50 rule in PMP?
The 50/50 rule is an earned value measurement technique where an in-progress task receives 50% credit when it starts and the remaining 50% when it completes. It's a simplified alternative to percent-complete tracking, most useful for short-duration tasks where detailed progress measurement isn't practical.
What is the difference between a progress report and a status report?
A progress report documents what work has been completed since the last reporting period — it's backward-looking. A status report provides a current snapshot of overall project health relative to the baseline, including schedule, cost, and key issues. Status reports are more diagnostic; progress reports are more descriptive.
How often should project performance reports be updated in construction?
Cadence should match risk level: WIP schedules monthly for financial close, cost and variance reports weekly on active projects. Executive dashboards work best when fed by automated ERP integration — manual monthly schedules are often outdated before they reach the people who need them.
What data should a construction project performance report include?
A complete report covers original and revised contract value, costs to date, percent complete, earned and billed revenue, over/under billing position, cost-to-complete, projected final cost, and projected margin. Bonding agents and lenders typically require this full set in a standardized format.