By the time a WIP report is finished, the margin damage is already done. A cost overrun that appeared in last month's close was probably visible in the field three weeks earlier — but nobody had a system to see it in time. That's not an accounting failure. That's a structural risk embedded in how construction finance has always worked.
AI-powered predictive analytics is changing that. Construction finance is shifting from a backward-looking accounting function into a forward-looking capability that flags overruns, labor slippage, and cash flow gaps while there's still time to act.
This article covers what predictive analytics actually means for construction finance teams, the most impactful use cases, the data foundation required to make it work, and what real-time financial intelligence looks like in practice.
Key Takeaways
- AI identifies budget overruns, labor slippage, and liquidity gaps before they become irreversible
- Fragmented data — spread across ERPs, spreadsheets, and disconnected field tools — is the biggest barrier to AI adoption, not the technology itself
- Real-time dashboards eliminate the 10–20 day WIP lag, replacing it with on-demand financial intelligence
- Construction finance managers who adopt AI analytics shift from data gatherers into strategic advisors
- Successful adoption starts with a clean, connected, automated data foundation — before any AI layer is added
Why Construction's Data Problem Is Really a Financial Risk Problem
Construction projects generate detailed financial data. The trouble is where that data lives — and when it becomes visible.
Each data source lives in a different system:
- Job cost actuals sit in the ERP
- Labor hours live in payroll
- Subcontractor commitments are tracked in project management tools
- Change orders get logged separately
None of these systems talk to each other automatically. Pulling a complete financial picture requires manual reconciliation and consolidation — usually across multiple spreadsheets.
The scale of this problem is well-documented. According to a 2021 Autodesk/FMI study, more than 80% of respondents said at least 25% of their project data was unusable, and only 17% said more than 75% of their data was actually usable. The same research estimated bad data cost the global construction industry $1.84 trillion in 2020.
The Reporting Lag Is a Financial Vulnerability
When financial reporting depends on manual spreadsheet consolidation and monthly close cycles, project managers and CFOs are always looking backward. By the time a cost overrun appears in a report, the window to course-correct has often closed.
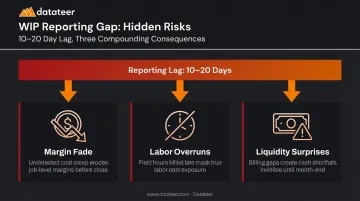
This creates three compounding risks:
- Margin fade — small cost variances accumulate undetected across phases until the damage is too large to reverse
- Labor overruns — hours-per-phase run over budget for weeks before finance sees it
- Liquidity surprises — cash shortages that could have been predicted weeks out instead arrive without warning
A 10–20 day WIP reporting cycle creates a structural gap between when financial risk develops and when leadership becomes aware of it. That gap is precisely what predictive analytics is designed to close.
What Predictive Analytics Means in Construction Finance
Most construction financial reporting is descriptive — it shows what already happened. Job cost reports, variance reports, WIP schedules — these are all retrospective by design. They answer the question: What did we spend?
Predictive analytics answers a different question: What is likely to happen next, and where?
In a construction finance context, that means using historical project data combined with current performance indicators to forecast future financial outcomes. A predictive model doesn't wait for a cost overrun to show up in a report — it identifies when current spending trajectories are on track to produce an overrun, early enough to intervene.
Why Construction Data Is Well-Suited for This
The construction industry is a strong candidate for predictive modeling because it generates highly structured historical data by default.
That includes data types that map directly to what AI and machine learning models need to recognize patterns and generate reliable forecasts:
- Completed project costs by phase and cost code
- Subcontractor performance histories
- Billing cycle patterns
- Labor productivity by crew type
This is structured, repeatable data — and construction firms accumulate it on every project.
The same Autodesk/FMI research found that more than 80% of respondents reported an increase in project data volume over the prior three years. The data foundation is already there. The gap is infrastructure — specifically, whether firms have the analytics layer to convert that volume into forecasts finance teams can actually act on.
Key AI Predictive Analytics Use Cases for Construction Finance
Budget Overrun Prediction
Cost overruns are the default outcome on large construction projects, not the exception. McKinsey's 2023 analysis of 500 global capital projects found average cost overruns ran at least 79% relative to initial budgets.
AI addresses this by analyzing current cost-to-complete data against historical benchmarks on similar projects. Rather than waiting for a cost code to blow its budget, the model generates early overrun probability signals based on spending velocity, committed costs, and pending change orders — at the job, phase, and cost-code level.
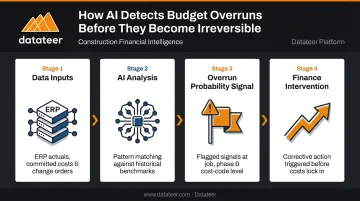
Platforms like Datateer automate this by pulling actual costs incurred, committed costs (POs, subcontracts), and projected final cost continuously from the ERP — replacing the painful month-end cost-to-complete refresh with ongoing automated tracking.
WIP and Revenue Recognition Forecasting
WIP schedules are the primary financial statement for tracking over/underbilling and projected profitability on active projects. They're also one of the most manual, error-prone processes in construction finance.
Predictive models can project percent-complete positions and flag overbilling or underbilling exposure before the period closes — giving finance teams the chance to adjust billing strategy proactively rather than correct errors after the fact. This matters for ASC 606 compliance, where underbillings and overbillings have direct balance sheet implications as contract assets and liabilities.
Labor Productivity and Slippage Detection
Labor is where margins most often disappear. FMI's 2023 Labor Productivity Study found that 60% of contractors said at least 11% of field labor costs are wasted or unproductive, and that poor productivity costs labor-intensive US contractors an estimated $30–$40 billion annually.
AI monitors hours-per-phase and labor cost against budget continuously, flagging specific cost codes that are trending over plan. The goal is to surface a labor budget problem on Tuesday — while a crew is still on site — not three weeks after payroll is cut when nothing can be done about it.
Cash Flow and Liquidity Forecasting
Cash flow pressure is the number one cause of contractor failure, according to CFMA. The payment environment compounds the problem: a 2025 survey of 800 construction professionals found subcontractors wait an average of 56 days for payment, while general contractors estimated they paid within 30 days — a perception gap with real liquidity consequences.
AI-driven cash flow forecasting pulls together billing schedules, receivables aging, retainage schedules, and historical collection patterns to generate rolling 30/60/90-day (or 13-week) cash position forecasts. Key inputs the model tracks include:
- Billing schedule vs. actual invoicing pace — where receivables are falling behind plan
- Retainage release timing — often the largest single liquidity event on a project
- Historical DSO by customer or project type — how long collections actually take vs. contract terms
- Committed outflows — upcoming subcontractor and supplier payments against available cash
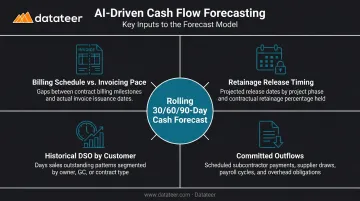
The result is a forward-looking liquidity view that lets finance teams act on a projected shortfall weeks before it arrives at the bank.
Cost Estimation Support from Historical Data
Historical project data works in both directions — it flags active overruns and sharpens future bids. AI models trained on actual cost performance by project type, phase, and cost code can identify where systematic underestimation has quietly eroded margins across previous work.
Burden rate analysis fits the same pattern. Knowing actual fully-burdened labor costs by craft and division — rather than relying on outdated budget assumptions — produces more defensible estimates and closes one of the most common gaps between bid margin and final margin.
The Data Foundation: Getting Construction Data AI-Ready
Predictive models are only as reliable as the data they process. This is where most AI initiatives stall.
Inconsistent cost code structures across projects and divisions, manual data entry errors, formula mistakes in spreadsheets, and systems that don't connect to each other — these aren't minor inconveniences. They produce unreliable forecasts that undermine confidence in AI-generated outputs and cause teams to abandon the tool.
The Autodesk/FMI research found only 36% of respondents had implemented a process for identifying and repairing bad data, and only 12% consistently incorporated project data into decision-making. KPMG's 2021 Global Construction Survey found just 16% of construction executives had fully integrated technology systems.
These gaps don't just slow down AI adoption — they make predictive outputs unreliable until the underlying data problems are solved.
What a Proper Data Foundation Requires
A working AI analytics foundation in construction requires:
- Automated extraction from the ERP, job cost modules, payroll, and billing — no manual exports required
- Cost code mapping standardized consistently across projects and divisions without manual upkeep
- Reconciliation between project management and financial systems handled automatically (Procore-to-Sage is the most common disconnect)
- Entry validation that catches broken or malformed data before it flows into reports
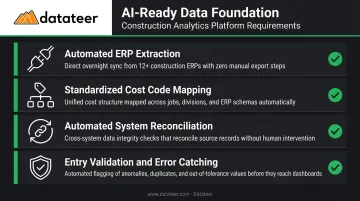
Datateer's implementation is structured around this foundation. The platform's automated data cleaning and standardization engine handles cost code mapping, catches broken entries, and builds a verified, unified data layer from the ERP before any dashboards go live. Setup takes 2–4 weeks, including direct integration with 12+ construction ERPs.
From Reactive Reporting to Real-Time Financial Intelligence
When financial data flows automatically from ERP to dashboard — refreshing overnight rather than waiting for a manual monthly close — the construction finance manager's role changes fundamentally.
The WIP report assembles itself. Cost overruns surface while projects are still active — not at period close when the damage is already done. The CFM's job shifts from preparing data to interpreting it, from forensic accounting to strategic partnership.
Double L Management's Business Analyst described it this way after adopting Datateer: "The very first time we accessed our data through a Datateer analytics dashboard, that one click replaced two weeks worth of prior work."
What Real-Time Financial Intelligence Looks Like in Practice
At the portfolio level, a CFO or finance leader should have access to:
- Live WIP dashboards showing percent-complete, earned revenue, over/underbilling position, and projected margin per job — updated automatically, not assembled manually
- Budget vs. actual tracking by project, phase, and cost code, available on demand rather than at month-end
- 13-week cash flow forecasting based on real-time project burn rates and retainage schedules
- Margin fade alerts that flag deteriorating jobs while they're still active
Datateer delivers this by integrating directly with major construction ERPs — including Procore, Sage, Viewpoint Vista, Acumatica, Foundation Software, CMiC, and others — and feeding pre-built executive dashboards through automated data pipelines that update overnight as standard.
The Strategic Impact
Catching margin fade while projects are still active is the core financial benefit. When a finance team can see cost-at-completion projections trending over budget at the cost code level — two months into a six-month project — they can take corrective action:
- Renegotiate subcontracts before commitments are final
- Adjust billing strategy to protect cash position
- Flag the issue for the PM while there's still time to course-correct
The difference between catching a margin problem at week eight versus week twenty-four on a six-month project is often the difference between a recoverable job and a written-off loss.
What to Look for in a Construction Analytics Solution
ERP Integration Depth
The single most important technical requirement is whether the solution connects directly and automatically to your ERP or requires manual data exports.
Native, automated integration is non-negotiable. Manual exports reintroduce the exact lag and error risk that analytics is supposed to eliminate. Two questions worth asking every vendor upfront: How frequently does the system refresh data? And can it integrate with legacy systems not on your standard list? Platforms like Datateer handle custom integrations for non-standard ERPs — if a vendor can't answer clearly, assume the integration is more fragile than it appears.
Construction-Specific Financial Logic
Generic business intelligence tools — Tableau, Power BI, Qlik — don't understand WIP schedules, ASC 606 percent-complete accounting, overbilling and underbilling calculations, or construction cost code hierarchies. Custom-configuring a generic BI tool to handle these calculations typically means a 12–18 month implementation that rarely delivers on its original scope.
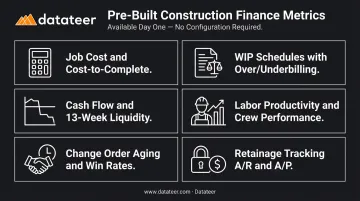
Purpose-built construction analytics platforms come with these calculations pre-built. The metrics that matter in construction finance should be available on day one:
- Job cost and cost-to-complete
- WIP schedules with overbilling and underbilling
- Cash flow and 13-week liquidity forecasting
- Labor productivity and crew performance
- Change order aging and win rates
- Retainage tracking (A/R and A/P)
Ask any vendor to show you a live WIP schedule with overbilling and underbilling calculations. If they need to explain how you'd configure it, that's your answer.
Frequently Asked Questions
Can AI do predictive analytics for construction?
Yes — and it's being deployed in the field right now. Machine learning models trained on historical job cost data forecast budget overruns, schedule risks, and cash flow positions with increasing accuracy, especially across projects that share similar type, size, or geography.
What data does AI use for construction financial forecasting?
The primary inputs are job cost actuals, budget-to-complete estimates, billing and receivables data, payroll and labor hours, subcontractor payment schedules, and historical project performance data from the ERP. The more consistently this data is structured and captured, the more reliable the forecasts.
How does AI help prevent budget overruns in construction?
AI flags cost-at-completion projections trending over budget at the cost code or phase level, early enough in the project lifecycle for corrective action to matter. The system surfaces warning signals based on current spending velocity against historical benchmarks — not after the damage is done at project close.
What is a WIP report and how does AI improve it?
A WIP (Work-in-Progress) report tracks over/underbilling and projected profitability across active projects. AI replaces the manual multi-week preparation process with automated dashboards that calculate percent-complete, earned revenue, and over/underbilling positions in near-real time.
How is predictive analytics different from standard construction reporting?
Standard reporting shows what has already happened: historical job costs, variance reports, completed WIP schedules. Predictive analytics projects what is likely to happen based on current trends and historical patterns — giving teams time to act before problems compound.
What's the first step for a construction firm looking to adopt AI analytics?
The first step is establishing a clean, connected data foundation — automating the flow of data from the ERP into a centralized analytics layer. Without reliable, current data, predictive models produce unreliable outputs. Datateer's Integration Blueprint provides a 60-second ERP compatibility check as a starting point for firms ready to assess their readiness.