The consequences are real. Research from Autodesk and FMI estimates that bad data cost the global construction industry $1.85 trillion in 2020, and FMI's analysis found that roughly one-third of poor project decisions trace back to data quality failures. By the time a CFO sees lagging financials, margin fade has already happened — and course-correcting becomes forensic accounting rather than active management.
This guide covers what separates a functional construction project portfolio management dashboard from a generic one: the five financial metric categories that matter most, the four dashboard types that serve different audiences, the structural components a dashboard must include, and why real-time ERP integration changes the entire financial management equation.
Key Takeaways
- Portfolio dashboards must track financial metrics — WIP, job cost margins, cash flow — not just schedule milestones
- Four distinct dashboard types serve different audiences: executive overview, financial intelligence, operational, and risk
- Manual WIP reporting cycles create dangerous lag; ERP-connected dashboards replace that with automated overnight ERP sync
- Effective dashboards connect multi-project roll-ups to drill-down detail and forward-looking budget forecasts
- 55% of construction companies lack a formal data plan, leaving the other half flying blind on portfolio health
What Is Construction Project Portfolio Management?
Construction project portfolio management (CPPM) is the coordinated oversight of multiple active construction projects to optimize financial outcomes, resource deployment, and strategic alignment across the entire business — not just a single job.
PMI defines portfolio management as selecting, prioritizing, and coordinating projects as a portfolio to increase organizational value. In construction, that translates to decisions that can't be made at the project level alone:
- Capital allocation — where to deploy available working capital across competing projects
- Risk identification — which projects are threatening portfolio-level financial health
- Margin protection — catching erosion across the job mix before it becomes unrecoverable
- Stakeholder reporting — giving owners, boards, and bonding agents a consolidated financial picture
Who Needs Portfolio-Level Visibility
CPPM serves the people asking questions that no single project dashboard can answer:
- CFOs and finance controllers — Are we winning as a business, or just keeping jobs moving?
- Division presidents and owners — Which projects are pulling the portfolio down?
- CPA advisory firms — Where is the client's cash, and what's the true WIP position?
Project Dashboard vs. Portfolio Dashboard
A project dashboard tracks one job: task completion, individual costs, schedule progress. A portfolio dashboard aggregates financial health across all active contracts — combined WIP position, backlog trends, cross-project margin performance, and liquidity across the entire business.
| Project Dashboard | Portfolio Dashboard | |
|---|---|---|
| Focus | Single job | All active contracts |
| Use | Operational execution | Strategic decisions |
| Audience | PMs, field teams | CFOs, owners, boards |
Construction firms routinely invest in the former and neglect the latter — which is exactly where financial blind spots form.
Key Financial Metrics Every Construction Portfolio Dashboard Should Track
Most project management dashboards default to schedule and resource views. A construction portfolio dashboard requires a financial-first orientation — these are the metrics that separate a useful construction dashboard from a generic one.
WIP and Revenue Recognition
Work-in-Progress is the foundational financial metric in construction portfolio management. WIP schedules provide a snapshot of a contractor's financial position and project performance — and AICPA & CIMA confirms they are commonly updated monthly and crosschecked against financial statements.
At the portfolio level, WIP tracking surfaces two critical risk conditions:
- Overbilling (billings in excess of costs) — cash received ahead of earned revenue, creating future performance obligations
- Underbilling (costs in excess of billings) — work performed but not yet invoiced, signaling cash flow exposure
Tracking these conditions across all active contracts — not just individually — tells leadership whether the portfolio is financially sound or accumulating hidden liability. Datateer's WIP & Financial Truth dashboard automates these calculations directly from the ERP, replacing the monthly spreadsheet marathon with continuous visibility.
Job Cost Performance
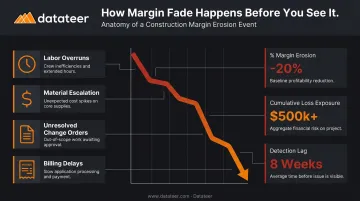
Job cost metrics include budget vs. actual cost by project, cost-to-complete (CTC), and gross margin by job. The critical concept here is margin fade — the gradual erosion of project margins as labor overruns, material escalation, and unresolved change orders accumulate.
FMI documented a case where an MEP contractor identified 17% margin fade, equipment costs running 55% over budget, and an $8M cumulative loss across four years. When job cost data arrives weeks after the decisions that drove the overrun, there's nothing left to recover.
Datateer's pre-built job cost dashboards surface budget vs. actual, CTC, and projected margin per job in real time across all active projects, with drill-down to cost code level.
Backlog and Revenue Pipeline
Backlog is a leading indicator of future revenue and operational capacity. ABC's Construction Backlog Indicator stood at 8.8 months in April 2026, providing a benchmark for how much contracted work sits ahead of firms in the commercial and industrial sector.
At the portfolio level, backlog tracking answers staffing, bonding, and bidding questions: Are we burning through backlog faster than we're replacing it? Do we have enough contracted revenue to support current overhead?
CFMA calculates backlog in months as backlog value divided by monthly revenue. A declining ratio — even with a healthy absolute backlog number — signals a firm is consuming capacity faster than it's replacing it.
Labor Cost and Productivity
Labor is typically the first place a troubled project shows up in the numbers. FMI's research found that 79% of contractors could improve labor productivity by 6% or more with better management practices, and that contractors with fewer labor cost overruns consistently show higher operating margins.
Portfolio-level labor metrics to track:
- Actual vs. budgeted labor hours by cost code
- Labor cost variance by project and crew
- Hours per unit for productivity benchmarking
Datateer's Labor & Materials Productivity dashboard flags labor budget blowouts in near real time — spotting the divergence on Tuesday rather than discovering it three weeks after payroll is cut.
Cash Flow and Liquidity
CFMA states that in commercial construction, every job begins in a negative cash position — expenses are incurred before revenue is collected. Retainage, typically 5% or 10% of total project cost, compounds this by holding earned revenue off the table until project completion.
Portfolio-level cash flow metrics include:
- Accounts receivable aging across all projects
- Retainage balances (A/R retainage held by owners, A/P retainage held on subs)
- Billings vs. collections trend
- 13-week working capital position
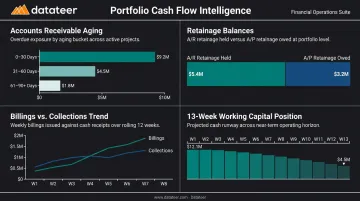
CFMA identifies cash flow pressure as the leading cause of contractor failure. A consolidated A/R aging view across all active projects is often what reveals a single slow-paying owner is quietly straining the firm's entire working capital position — before it becomes a banking conversation.
The 4 Types of Construction Portfolio Dashboards
Different stakeholders need different views of the same underlying data. Construction firms typically need all four of these dashboard types working together.
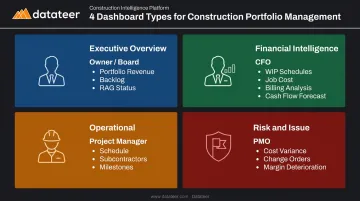
Type 1: Executive Portfolio Overview Dashboard
Built for owners, presidents, and boards, the executive dashboard answers one question — Are we winning? — in under 30 seconds. It displays:
- Portfolio-level revenue and margin performance
- Total backlog and pipeline health
- RAG (Red/Amber/Green) status across active projects
- Major risk flags without operational detail
Datateer's Executive Strategy & Solvency suite serves this function, including return on assets/equity/revenue tracking and a six-month forecasted liquidity view that gives leadership early warning before cash positions tighten.
Type 2: Financial Intelligence Dashboard (WIP & Job Cost)
This is the CFO and finance controller's command center — and the dashboard type most commonly missing in firms still relying on spreadsheets. It surfaces:
- WIP schedules with over/underbilling positions per project
- Job cost performance against budget
- Billing analysis and collections status
- Forecasted margins across all active contracts
Datateer's Financial Operations & Cash Management suite covers this ground through three integrated dashboards: AR & AP Health, WIP & Financial Truth, and Job-Level Cash Flow.
Type 3: Operational Dashboard (Schedule & Resources)
Built for project managers and field leaders, the operational dashboard tracks schedule performance, subcontractor progress, milestone status, and resource utilization. Tools like Procore handle this well — but the real value comes when field data connects to financial performance.
Datateer's Project Excellence & Field Operations suite bridges that gap, pulling Procore operational data alongside Sage or Vista financial data to give project managers and finance teams a shared view of how field performance is tracking against budget.
Type 4: Risk and Issue Dashboard
PMO leaders and governance teams need a consolidated view of project-level risk across the entire portfolio. This dashboard aggregates:
- Cost variance flags by project
- Aging change orders (pending, stalled, denied)
- Overdue mitigation actions
- Margin deterioration indicators
Without this view, individual project problems become portfolio-level financial events before leadership has any visibility. Datateer's Change Order Impact & Aging Analytics and Margin Fade Prevention modules address this directly: they track stalled change orders, deteriorating margins, and cost variance trends continuously across the portfolio.
Each dashboard type serves a distinct audience, but they work best as a connected system — where a risk flag in the field shows up in the finance dashboard and escalates to the executive view without anyone manually moving data between them.
What Should a Construction Portfolio Dashboard Include?
Beyond the metrics themselves, several structural components determine whether a portfolio dashboard is actually usable.
Multi-Project Roll-Up with Drill-Down
A portfolio dashboard must aggregate data from all active projects — total budget, combined WIP, aggregate margin — while allowing users to click into any individual project for detail. Without drill-down, it's a summary report, not a decision-support tool.
Datateer's architecture supports this hierarchically: start at the portfolio level, drill to project, then to phase, cost code, and source transaction — all without leaving the dashboard.
Real-Time ERP Data Integration
An effective portfolio dashboard requires a direct, automated connection to the firm's ERP. Manual exports introduce lag and errors that erode reliability over time — and by the time leadership is reviewing stale data, the decisions that mattered have already been made.
Datateer connects directly to 12+ construction ERPs with automated overnight data syncing as standard:
- Procore
- Sage 100 / 300 / Intacct
- Viewpoint Vista and Spectrum
- Acumatica Construction
- Foundation Software
- CMiC and Jonas Construction
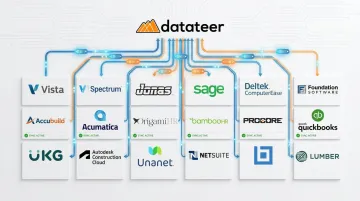
More frequent updates are available for firms that need them. Setup takes 2–4 weeks, and the annual fee (starting at $10,000/year per data source, unlimited users) only begins once data is flowing.
RAG Health Status Indicators
Red/Amber/Green visual coding makes portfolio health immediately scannable. For financial metrics, RAG thresholds might be configured around margin falling below a defined percentage, WIP underbilling exceeding a risk threshold, or AR aging beyond 45 days.
Leadership should be able to spot which projects need immediate attention in seconds, not after reading every line on the screen.
Budget vs. Actual Panels with Forecasting
Static budget comparisons miss the margin fade problem entirely. Dashboards must show not only where budgets stand today, but where they are projected to end.
Datateer's Budget vs. Actuals dashboard includes cost-to-complete projections and trend lines that show whether each job is converging or diverging from target. That forward visibility is available continuously — not locked behind a monthly close cycle.
Why Real-Time Data Is the Difference Between Reactive and Proactive Management
The typical manual reporting cycle in construction finance runs like this: data is pulled from the ERP, formatted in spreadsheets, reviewed, reconciled, and distributed. WIP schedules are commonly updated monthly per AICPA & CIMA guidance. Even that monthly cadence can lag actual project conditions by two to three weeks when the process is manual.
By the time leadership sees the numbers, the financial situation has already changed.
The business cost of that lag:
- Margin fade is discovered after the project has moved on, leaving no room to course-correct
- Billing delays create cash flow pressure that could have been flagged and addressed earlier
- Risk identification becomes a post-mortem exercise — problems are catalogued after the damage is done, not caught while there's still time to act
How automated, daily-updated dashboards change the equation:
- Finance teams shift from data gathering to strategic analysis
- Field and office see the same numbers, eliminating the information gap that generates conflict
- Decisions are made based on current conditions — not what happened a month ago
That shift from reactive to proactive is exactly what Datateer clients report after their first week on the platform. Double L Management put it directly: "The very first time we accessed our data through a Datateer analytics dashboard, that one click replaced two weeks worth of prior work."
Best Practices for Construction Portfolio Dashboard Management
Define Purpose Before You Build Before building a dashboard, define which decisions it needs to support and for which role. An executive overview built for the CFO looks entirely different from an operational view built for project managers. Start with two or three use cases and the metrics that drive those decisions.
Standardize Data Inputs Across Projects Portfolio dashboards are only as reliable as the underlying project data. Inconsistent cost code structures across projects make roll-up data meaningless. Datateer's automated data cleaning engine standardizes cost codes across systems, catches malformed entries, and maps data into a unified structure. This eliminates the manual reconciliation work that typically drags out implementation by weeks.
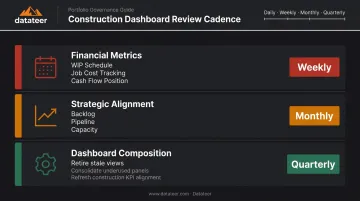
Establish a Regular Review Cadence CFMA recommends reviewing gross profit margin at least monthly; for portfolio dashboards, that cadence breaks down by dashboard type:
- Financial metrics (WIP, job cost, cash flow): weekly review
- Strategic alignment (backlog, pipeline, capacity): monthly review
- Dashboard composition: quarterly review to retire stale views as the portfolio shifts
Only 55% of construction companies have a formal data plan. Firms that pair clean data inputs with consistent review rhythms catch problems earlier — and spend less time in meetings defending numbers no one trusts.
Frequently Asked Questions
What is construction project portfolio management?
Construction project portfolio management is the coordinated oversight of multiple active projects to optimize financial outcomes, resource deployment, and strategic alignment. Unlike single-project management, it focuses on aggregate financial health, cross-project risk, and portfolio-level capital decisions rather than individual job execution.
What are the 4 types of dashboards used in construction project portfolio management?
The four types, each serving a distinct audience:
- Executive portfolio overview — owners and boards
- Financial intelligence (WIP, job cost) — CFOs and controllers
- Operational (schedule, resources) — project managers
- Risk and issue dashboards — PMO leaders and governance teams
What should a construction project portfolio management dashboard include?
Core components include:
- Multi-project roll-up with drill-down to individual project detail
- Real-time ERP data integration
- RAG health status indicators
- Budget vs. actual panels with cost-at-completion forecasting
- Portfolio timeline showing schedule overlap and resource demand
What financial metrics should a construction portfolio dashboard track?
Five key categories to track:
- WIP positions (overbillings and underbillings)
- Job cost performance including margin by project
- Backlog and revenue pipeline
- Labor cost variance
- Portfolio-level cash flow including AR aging and retainage balances
What is the difference between a project dashboard and a portfolio dashboard in construction?
A project dashboard focuses on a single job — its tasks, costs, and schedule. A portfolio dashboard aggregates data across all active projects to give leadership a consolidated view of financial health, risk exposure, and strategic position across the entire business.
How often should a construction portfolio dashboard be updated?
Best practice is automated daily updates for financial metrics, replacing the manual monthly cycle. ERP-connected platforms like Datateer sync overnight as standard, with more frequent updates available on request.