Introduction
Most construction firms know exactly what they've spent on a project. They have job cost reports, budget variance summaries, and cost-to-complete estimates that get updated regularly. What many struggle to answer with the same confidence is: what will we actually earn next quarter, and when?
That gap matters. In a project-based business where revenue accrues over months or years — not at the moment a sale closes — the absence of a reliable revenue forecast is where financial surprises originate.
Margin erosion goes undetected. Cash shortfalls arrive without warning. Finance teams spend their time explaining what already happened rather than shaping what comes next.
This article defines what revenue forecasting specifically means in construction — it's not the same as cost forecasting — and breaks down what it tracks and why it's more complex than forecasting revenue in most other industries. It also outlines how firms can build forecasts that are accurate enough to drive decisions.
Key Takeaways
- Construction revenue forecasting projects earned revenue — not billed or collected — using percentage-of-completion accounting
- WIP reports, signed backlog, and probability-weighted pipeline are the three core inputs
- Change orders, retainage, and managing dozens of concurrent projects make construction forecasting uniquely difficult
- Most firms struggle at the company-wide rollup, even when project-level estimates are solid
- Spreadsheet-based processes compound errors fast — often making the forecast stale before it reaches the CFO
What Does Revenue Forecasting Mean in Construction?
Revenue forecasting in construction is the process of projecting how much a firm will earn — and when — across its active projects, signed backlog, and bid pipeline. The key word is "earned," not billed and not collected.
That distinction is more than semantic. Under percentage-of-completion accounting (the standard method aligned with ASC 606), revenue is recognized as costs are incurred against total estimated project costs — not when invoices go out the door or when an owner pays.
Revenue Forecasting vs. Cost Forecasting
These two functions are often confused, but they answer different questions:
- Cost forecasting asks: what will this project spend?
- Revenue forecasting asks: what will this firm earn, and when?
In construction, the two diverge because revenue recognition is tied to project progress, not billing cycles. A firm can invoice aggressively and still have less earned revenue than it thinks — or it can complete significant work without billing for it at all.
How Earned Revenue Is Calculated
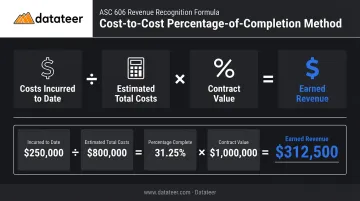
The cost-to-cost method is the most widely used approach. The formula:
Costs incurred to date ÷ Estimated total costs × Total contract value = Earned revenue to date
A quick example: a contractor has spent $250,000 on a $1,000,000 contract with estimated total costs of $800,000. That's 31.25% complete ($250K ÷ $800K), meaning $312,500 in revenue has been earned — regardless of what's been billed. The AICPA confirms this cost-based input method as an appropriate measure of progress for contractors under ASC 606.
Two Levels That Both Matter
Effective revenue forecasting operates on two levels:
- Project-level — what will this individual job earn going forward, at what pace?
- Company-level — what does total revenue look like across all active jobs, backlog, and pipeline for the next quarter or year?
Most firms handle project-level forecasting reasonably well. The company-level view — aggregating dozens of jobs at different stages, with different contract types and billing schedules — is where forecasts typically break down.
That's also where the real strategic decisions get made: whether payroll is covered in 60 days, whether to pursue the next major bid, what year-end will actually look like.
What a Construction Revenue Forecast Actually Tracks
Work in Progress (WIP)
WIP is the foundation. A WIP schedule captures the financial state of every active project: earned revenue to date, billed revenue to date, estimated cost at completion, and remaining contract value. Without an accurate, current WIP schedule, there is no credible company-level revenue forecast — just guesswork assembled from memory and old spreadsheets.
Over- and under-billing positions compound this directly. When a firm has billed more than it has earned, that excess is a liability on the balance sheet — not revenue. When it has earned more than it has billed, real revenue is sitting uncaptured. A contractor who has completed 90% of a project but billed only 70% carries a 20% underbilling position that can overstate working capital and distort profitability on the income statement.
Both positions distort the true financial picture when not modeled explicitly in the revenue forecast.
Backlog and Pipeline
Backlog is the most reliable forward-looking input. It's contracted revenue from signed but not-yet-completed work. The key is modeling when that revenue will be earned — not just how much there is in total. Dropping backlog in as a lump sum ignores a critical timing reality: most project revenue follows an S-curve — slow to start, accelerating through mid-project, tapering at close. Phasing backlog by month against that curve is where forecast accuracy is actually built.
Industry context: ABC's Construction Backlog Indicator reached 8.6 months in March 2026, with civil infrastructure firms carrying even longer runway.
Pipeline is less reliable but still essential to model. A $6M bid at a 35% win probability contributes $2.1M to the probabilistic forecast — not $6M. Failing to probability-weight pipeline produces an inflated revenue outlook that drives hiring and bonding decisions based on contracts that may never be signed.
Retainage
Retainage deserves its own line in the forecast. Typically 5–10% of each billing is withheld by the owner until project closeout. A forecast that doesn't model retainage release as a separate, timed item consistently overstates near-term revenue availability — setting up cash shortfalls that were foreseeable months earlier.
The Unique Complexities of Construction Revenue Forecasting
Construction revenue forecasting is harder than it is for a product, subscription, or service business — and four specific friction points explain why.
The Moving-Target Problem
Percentage-of-completion means revenue accrues continuously, and the rate of accrual shifts with every cost update, change order approval, or schedule change. Unlike a product sale recognized at a single moment, construction revenue is a living number. A forecast built on last month's cost data is already stale — continuous reforecasting isn't a best practice, it's a requirement.
Change Orders Disrupt Everything
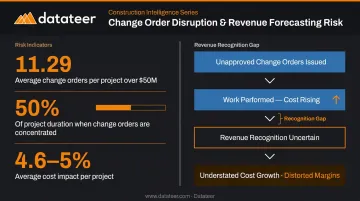
According to AIA's analysis of 18,229 completed projects, projects over $50M averaged 11.29 change orders — with most occurring in the final 50% of project duration. The cost impact averaged 4.6–5% of original contract value.
For revenue forecasting, pending or unapproved change orders create a specific problem: crews are performing real work against uncertain revenue. If unapproved change orders are excluded from the forecast, the model understates cost growth while appearing to show stable margins. They must flow through a documented approval process that feeds both the WIP report and the revenue forecast in real time.
Project Stacking
Construction firms run multiple projects simultaneously, each at a different completion stage, with different contract types (lump sum, GMP, T&M), billing cycles, and retainage terms. Aggregating all of this into a single company-level forecast is not a data problem — it's a structural one. A subscription business has uniform transactions. Construction has none of that consistency.
Margin Fade
As projects progress, estimated costs at completion often creep upward — labor inefficiencies, material overruns, scope growth. This erodes the profit embedded in the original revenue estimate without changing the contract value. The firm earns the same top-line revenue, but keeps less of it. The window to act is narrow. Catching margin fade while PMs can still redirect crews or renegotiate scope is what separates a useful forecast from a historical record.
Common Revenue Forecasting Methods and Key Steps
Most construction finance teams use four methods in combination, applying each where the data supports it:
| Method | When to Use |
|---|---|
| Cost-to-cost / percentage-of-completion | Calculating earned revenue on active jobs |
| Historical trend analysis | Estimating future run rates from past project performance |
| Backlog conversion / rolling forecast | Projecting confirmed future revenue from signed contracts |
| Probability-weighted pipeline | Forecasting pre-award pursuits with realistic win rates |
Building the Forecast: Core Steps
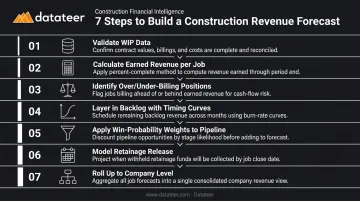
- Validate and update WIP data across all active projects — stale inputs invalidate everything downstream
- Calculate earned revenue per job using the cost-to-cost method
- Identify over/under-billing positions and model them as assets or liabilities accordingly
- Layer in backlog with projected revenue curves by timing (not as a lump sum)
- Apply win-probability weights to pipeline pursuits
- Model retainage release as a separate, timed line item
- Roll up to company level and establish a regular refresh cycle
Refresh Cadence
How often you refresh matters as much as how you build the forecast:
- Monthly: The AICPA-recommended baseline — sufficient for audit prep, inadequate for active project control
- Weekly: AACE-supported standard for projects with active cost movement or schedule risk
- Daily: AACE guidance for S-curve updates on fast-moving or at-risk projects
Monthly cycles leave too much time between when margin fade starts and when finance teams can see it. Weekly or daily refresh cycles close that gap.
Why Revenue Forecasts Break Down — and How to Fix It
The root cause is usually the same: revenue forecasting is still assembled manually. ERP exports feed spreadsheet WIP templates, which get reconciled against billing data from another system, then summarized in a format that took two weeks to produce and is already outdated by the time it reaches the CFO.
Research on operational spreadsheets found that 94% of business spreadsheets contain errors. When WIP, backlog, billing, and cost data flow through multiple disconnected systems and manual reconciliation steps, that error rate compounds at every handoff.
The practical result: finance teams spend the first two weeks of every month on data collection instead of analysis. By the time the revenue forecast is ready, the numbers it's based on are already 10–20 days old.
What a Modern Setup Looks Like
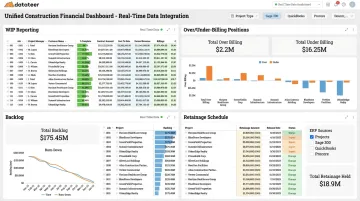
A connected revenue forecasting system pulls directly from the ERP in real time, standardizes cost codes across projects, and auto-calculates earned revenue using cost-to-cost. WIP, backlog, and billing positions surface in a single unified view.
That's the problem Datateer solves. The platform integrates directly with 20+ construction ERPs — including Procore, Sage, Viewpoint Vista, Acumatica, Foundation, CMiC, and Jonas — and automates the full financial reporting stack:
- WIP reporting and earned revenue calculation
- Over/under-billing tracking and retainage schedules
- Change order impact analysis
- Unified backlog and billing position views
A Double L Management business analyst described the shift plainly: "The very first time we accessed our data through a Datateer analytics dashboard, that one click replaced two weeks worth of prior work."
The Strategic Shift
When revenue forecasting moves from a monthly close ordeal to a continuous, automated capability, finance stops being a data-gathering function. CFOs can answer "what does our revenue look like in 90 days?" in minutes. They can identify margin fade while there's still time for PMs to intervene. They can walk into leadership meetings with current data instead of apologizing for numbers that were assembled from last month's exports.
That shift changes what finance is for — from closing the books on what happened to shaping decisions about what happens next.
Frequently Asked Questions
What are the 4 forecasting methods in construction?
The four methods are:
- Cost-to-cost percentage-of-completion — for active jobs
- Historical trend analysis — for run-rate estimation
- Backlog conversion and rolling forecasts — for signed contracts
- Probability-weighted pipeline forecasting — for pre-award pursuits
Most construction firms use all four in combination, depending on where a project sits in its lifecycle.
What are the 7 steps to building a construction revenue forecast?
The core steps are:
- Validate WIP data
- Calculate earned revenue per project using cost-to-cost
- Identify over/under-billing positions
- Layer in backlog with revenue timing curves
- Weight pipeline by win probability
- Model retainage release as a separate line item
- Refresh the consolidated forecast at the company level on a regular cadence
What is the difference between revenue forecasting and cost forecasting in construction?
Cost forecasting predicts what a project will spend. Revenue forecasting predicts what will be earned and when. They diverge in construction because revenue is recognized based on percentage of completion — not when invoices are issued or payments received — meaning aggressive billing doesn't equal higher earned revenue.
How does WIP reporting connect to revenue forecasting?
WIP is the foundational input. It captures earned-to-date, billed-to-date, estimated cost at completion, and remaining contract value per project. An accurate, current WIP schedule is a prerequisite for any reliable revenue forecast. Without it, the company-level view is built on assumptions rather than data.
Why is construction revenue forecasting harder than in other industries?
Several factors combine to make it uniquely difficult:
- Revenue accrues incrementally across multi-year projects
- Dozens of jobs must be tracked simultaneously
- Change orders constantly shift cost and revenue estimates
- Retainage defers cash availability
- Underlying data lives across disconnected ERP and project management systems, each requiring reconciliation before aggregation