Introduction
Construction cost overruns are the norm, not the exception. Research analyzing more than 16,000 projects found that 91.5% go over budget, over schedule, or both, with a mean cost overrun of 62%. Less than 1% finish on time, on budget, and deliver promised benefits.
Traditional construction finance operates on a lag — not because data is missing, but because it arrives too late to act on. WIP reports compiled from manual ERP exports and spreadsheet formatting reveal overruns weeks after the fact, by which point the window to course-correct has already closed.
This guide covers what it takes to shift from reactive accounting to predictive cost control in 2026: the mathematical models driving forecast accuracy, real-world applications across labor, materials, and subcontractor risk, and the data infrastructure that makes any of it possible.
Key Takeaways
- Predictive analytics uses historical and real-time project data to forecast overruns before they compound
- EVM, regression analysis, and Monte Carlo simulation are the core modeling engines
- Real-time financial data — not stale monthly reports — is the non-negotiable prerequisite
- Implementation starts incrementally with existing ERP data — no full historical overhaul required
- The end goal: finance teams spending less time pulling data and more time acting on it
Why Construction Cost Overruns Keep Happening in 2026
Structural Root Causes
The same failure patterns repeat across projects regardless of size or sector:
- Fragmented data across field, office, and accounting teams with no unified view
- Delayed spend visibility that turns minor slippage into confirmed overruns
- Reactive decision-making where problems surface only after the budget has moved
Monthly WIP closes give finance teams a backward-looking snapshot. By the time a cost variance shows up in a report, crews have moved on, commitments have been made, and recovery costs more than prevention would have.
2026 Market Conditions Make Static Budgets Obsolete
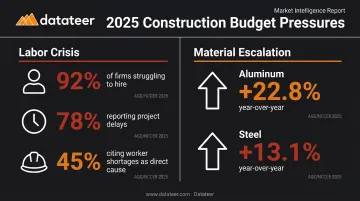
Material price volatility has made fixed-price assumptions increasingly fragile. AGC data from August 2025 shows the scale of that exposure:
| Material Category | Year-Over-Year Change |
|---|---|
| Aluminum mill shapes | +22.8% |
| Steel mill products | +13.1% |
| Nonresidential construction inputs (overall) | +2.5% |
A budget locked in at bid time can be structurally underwater before crews ever mobilize.
Labor availability compounds the problem. The 2025 AGC/NCCER Workforce Survey found 92% of construction firms struggling to hire workers, with 78% reporting at least one project delay and 45% citing worker shortages as a direct cause. Tight labor markets mean productivity assumptions built into estimates rarely survive first contact with actual crews.
The Data Utilization Gap
Those external pressures don't hit as hard when a firm can see them coming — but most can't. FMI and Autodesk research found that more than 80% of construction leaders characterized at least 25% of their project data as unusable — and bad data cost the industry an estimated $1.84 trillion in global construction losses in 2020. Construction firms collect large volumes of financial data. The problem is that most of it never gets analyzed in time to matter.
Predictive analytics closes that gap by turning project data into forward-looking signals — before the overrun is already on the books.
What Is Predictive Analytics in Construction?
Predictive analytics in construction applies statistical models, machine learning, and historical project data to generate forward-looking forecasts about cost, schedule, and resource performance. It's distinct from:
- Descriptive analytics — what happened (monthly cost reports, variance summaries)
- Diagnostic analytics — why it happened (root cause analysis after the fact)
- Predictive analytics — what is likely to happen next, based on current trajectory
- Prescriptive analytics — what action should be taken to change that trajectory
Most construction firms are still operating in the first two tiers. The KPMG Global Construction Survey 2025/2026 found that only 24% of firms have integrated AI into more than half of their projects, and fewer than 10% claim cutting-edge technology status. Monthly cost reports remain the default, which means most teams are navigating with a map drawn three weeks ago.
What Predictive Analytics Is Not
Understanding what predictive analytics isn't matters as much as knowing what it is — particularly before committing to implementation.
Predictive analytics doesn't replace experienced project managers or estimators. It gives them earlier warning. The model flags, for example, that a labor productivity decline in week 3 historically precedes a 5–8% cost overrun by week 8 — giving the PM time to intervene before the overrun materializes, not after.
The Mathematical Models Behind Construction Cost Prediction
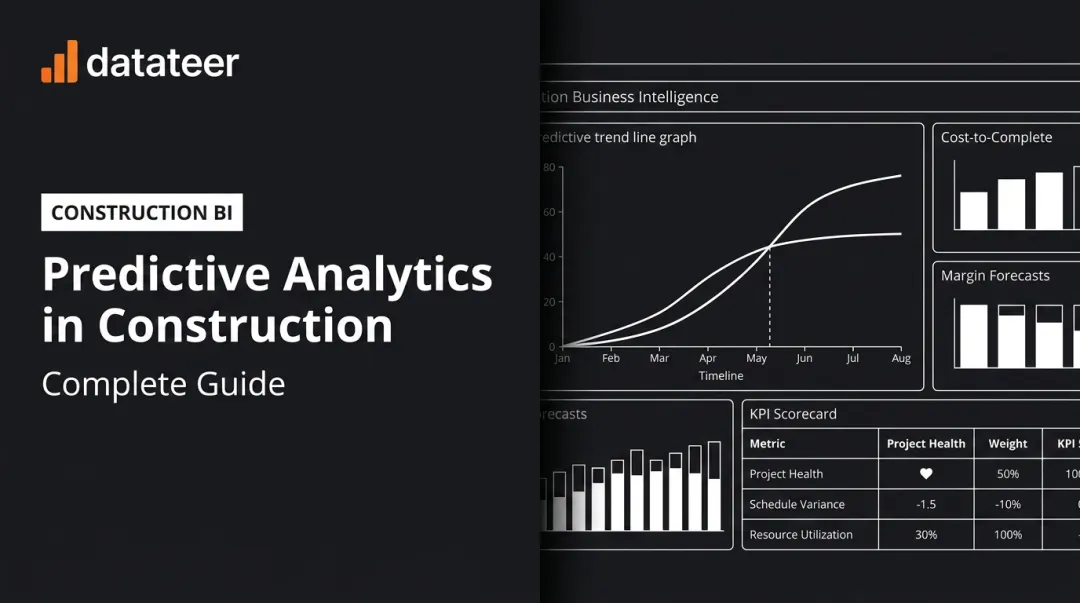
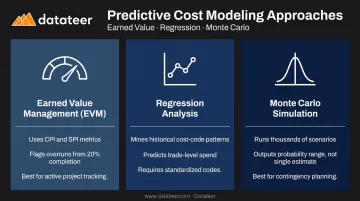
Earned Value Management (EVM)
EVM is the foundational framework for predicting final cost outcomes from early-stage performance data. Two metrics do most of the work:
- Cost Performance Index (CPI) = Earned Value ÷ Actual Cost. CPI below 1.0 means you're spending more than the work is worth.
- Schedule Performance Index (SPI) = Earned Value ÷ Planned Value. SPI below 1.0 means you're behind planned progress.
Example: A $10M project at 20% completion has earned $1.8M of value but spent $2.2M. CPI = 0.82.
Foundational EVM research found that cumulative CPI at the 20% completion mark rarely changes by more than 10% for the remainder of the project. A CPI of 0.82 that early is a strong signal the project will finish significantly over budget — not a temporary blip to wait out.
Regression Analysis
Regression models use historical cost-code-level data from completed projects to predict spend on similar scopes, trades, or project types. If your firm has completed 40 commercial office fit-outs, regression can identify which cost codes consistently track over budget and by how much — before the next project hits those phases.
The prerequisite: standardized cost codes across all projects. Without consistent coding, the model has no pattern to learn from.
Monte Carlo Simulation
Monte Carlo runs thousands of project scenarios simultaneously, varying cost and schedule inputs within defined probability ranges to produce a distribution of possible final costs — not a single-point estimate. AACE International Recommended Practice 118R-21 defines this approach for contingency determination using estimate ranging for inherent risks.
The output is a probability curve. For example:
- 70% probability: project finishes between $9.2M and $10.8M
- 15% probability: final cost exceeds $11M
That range is far more useful for contingency budgeting than a single-point estimate with no confidence interval attached.
Machine Learning Applications
ML models trained on large historical project datasets can reveal non-obvious cost risk patterns. A 2025 ScienceDirect study on construction cost prediction using advanced ML reported an R² of 0.988 on a dataset of 4,477 construction cost entries — a high degree of predictive accuracy when models are trained on clean, structured data.
The accuracy of any ML model depends entirely on what feeds it — which brings every method back to the same bottleneck.
The Critical Dependency
EVM, regression, Monte Carlo, and ML all require the same thing: clean, standardized, and timely data inputs. Stale ERP exports, inconsistent cost codes, and manual data entry errors don't just reduce accuracy — they produce confidently wrong forecasts. Firms that treat data infrastructure as an afterthought are building forecasting models on a foundation that guarantees drift.
How Predictive Analytics Prevents Cost Overruns: Key Applications
Labor Cost Forecasting and Slippage Detection
Predictive models monitor actual hours versus budgeted hours per cost code and flag slippage before it compounds. A crew installing 20% fewer units per hour than the estimate in week 2 is a recoverable problem. The same shortfall discovered at month-end close, three weeks later, locks in a confirmed overrun.
Datateer's Labor & Materials Productivity dashboards surface these variances "on Tuesday instead of three weeks after payroll is cut." That timing enables corrective action — crew resequencing, scope reallocation — while the project is still in motion.
Material Procurement and Price Volatility Management
With aluminum up 22.8% year over year and steel up 13.1%, procurement timing directly affects margin. Predictive models tracking actual purchased cost per unit against bid-estimate prices and current market indices identify which projects carry the most material price exposure, and when that exposure peaks.
Datateer's Material Price Escalation module benchmarks actual costs against the Producer Price Index and ENR Material Cost Index, rolling escalation impact up to project margin. This identifies at-risk projects before the margin damage is locked in, and supports escalation clause negotiations with owners using actual cost data.
Subcontractor Risk Scoring and Change Order Prediction
Historical subcontractor performance data (cost, schedule, quality) can generate risk scores for both active and prospective subs. Pattern recognition in RFI and change order data flags downstream cost risk before formal change orders are submitted, giving finance teams advance visibility into likely margin impact.
Datateer's Change Order Impact & Aging Analytics tracks every change order through its full lifecycle: pending, approved, denied, and executed. Each record carries aging by days since submission and margin impact tied to specific cost codes. Stalled change orders — where work is complete but approval hasn't arrived — get flagged explicitly, creating accountability before the exposure compounds.
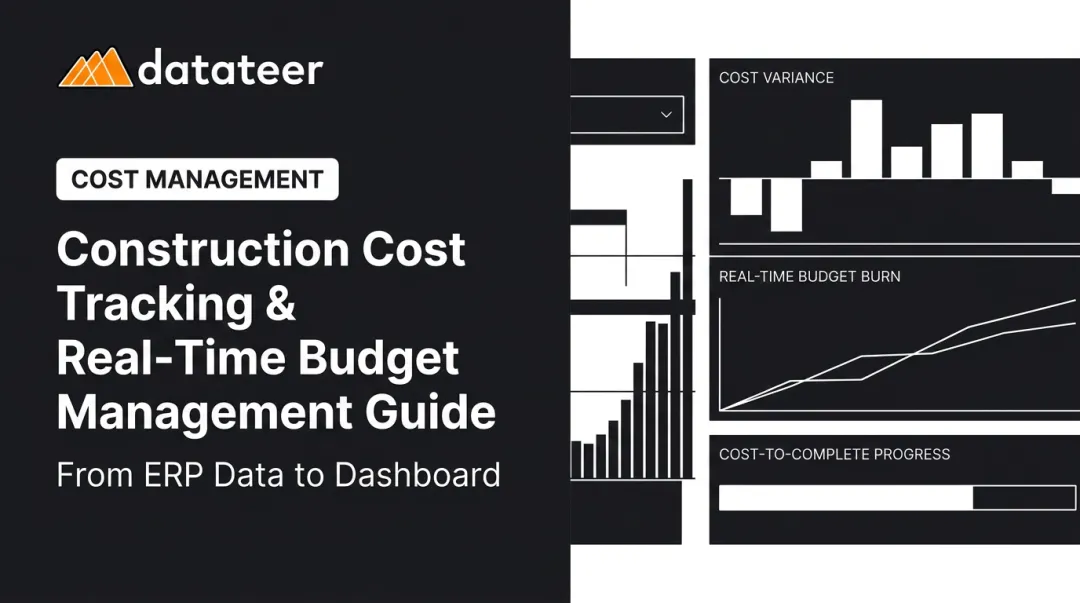
WIP and Cash Flow Forecasting
Predictive analytics applied to WIP schedules can project over-billing and under-billing positions weeks ahead. CFOs who know their draw schedule is diverging from the burn rate on Wednesday can act before month-end: adjusting billing, managing vendor timing, or opening a credit facility conversation with the bank before the shortfall arrives.
Datateer's 13-week cash flow forecasting projects working capital requirements based on real-time project burn rates and retainage schedules, replacing the end-of-month cash flow surprise with a six-month forward view.
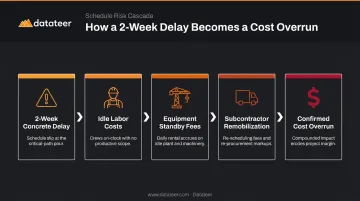
Schedule Delay Cost Modeling
A two-week concrete delay doesn't just push the schedule. It triggers predictable downstream consequences:
- Idle labor costs accumulate while crews wait for the critical path to clear
- Equipment standby fees run on rented or leased assets sitting unused
- Subcontractor remobilization adds fixed costs each time a trade returns to the site
Predictive tools model these consequences before a recovery path is chosen. Project teams can compare the cost of crashing the schedule against the cost of floating the delay using actual numbers, not estimates built on experience alone.
The Data Foundation: Real-Time Financial Visibility Enables Predictive Control
The WIP Lag Problem
Every predictive model described above depends on current data. When WIP reports take 10–20 days to compile from manual ERP exports, spreadsheet formatting, and cross-system reconciliation, the data feeding those models is already stale. The overrun you're trying to predict has already happened.
Datateer's core value proposition addresses this directly: the platform replaces a 10–20 day WIP lag with overnight automated data sync and a 2-minute dashboard refresh, pulling directly from the ERP without manual exports or VLOOKUP marathons. The 2-minute figure is the query speed once data is synced — not a claim that ERP data updates in real time, but that once it does update, the analysis is immediate.
What Healthy Data Infrastructure Actually Looks Like
| Requirement | Why It Matters |
|---|---|
| Standardized cost codes across all projects | Enables regression and ML models to find patterns |
| Direct ERP integration (no manual exports) | Eliminates errors introduced by human data handling |
| Automated data cleaning and validation | Catches broken entries before they corrupt forecasts |
| Overnight (or faster) data refresh | Keeps models fed with current information |
Datateer handles cost code standardization as part of its automated data cleaning process — it's not a prerequisite clients must solve before implementation. The platform's engine maps each firm's unique data logic, reconciles cross-system data (such as Procore project commits to Sage invoices), and standardizes the output automatically during the 2–4 week setup.
How Datateer Connects to Your Existing ERP Stack
Datateer integrates with 12+ construction ERPs and automates the full data flow from ERP to executive dashboards. Supported systems include:
- Procore, Sage 100/300/Intacct, Viewpoint Vista, Viewpoint Spectrum
- Acumatica Construction, Foundation Software, CMiC, Jonas Construction
- QuickBooks, NetSuite, and custom integrations for legacy systems
From day one, clients get access to 12 pre-built dashboards across four suites: Executive Strategy & Solvency, Financial Operations & Cash Management, Project Excellence & Field Operations, and Resource Productivity. That includes Job Costing & Cost-to-Complete (with CPI/SPI tracking), WIP Reporting, Cost Variance, Material Price Escalation, Labor Productivity, and Margin Protection — all mapped and running as soon as data flows in.
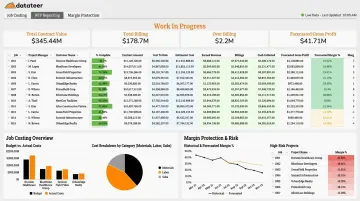
For construction finance teams spending evenings on spreadsheets, that means the shift from what Datateer calls "Excel Autopsy" to actual analysis: the data is ready, the dashboards are live, and the time that used to go into formatting now goes into decisions.
Implementing Predictive Analytics: A Practical Roadmap
Phase 1: Establish Your Historical Data Baseline
Audit completed project data for consistency. Three questions drive this audit:
- Are cost codes applied consistently across projects, trades, and phases?
- Which data fields are reliably populated?
- Which are sparse, inconsistent, or missing entirely?
This historical archive becomes the training data for regression models and the benchmark for EVM comparisons. Without it, predictive models have nothing to learn from. Datateer supports CSV uploads alongside automated ERP feeds, so firms can fold pre-integration historical data into the same analytical environment.
Phase 2: Connect Real-Time Data Flows from Your ERP
Replace manual exports and spreadsheet workflows with automated data pipelines that sync job cost, labor, and WIP data on a consistent schedule. Predictive models fed by stale data skip the early warning entirely and deliver confidently wrong late ones instead.
The standard pattern: direct ERP integration → automated data cleaning and cost code standardization → overnight refresh → dashboards populated without manual intervention.
Once that pipeline is running reliably, you're ready to build outputs on top of it.
Phase 3: Start with High-Value, Lower-Complexity Outputs
Before building Monte Carlo models or training ML algorithms, start with outputs that deliver immediate value and build team confidence:
- EVM dashboards tracking CPI and SPI by project, flagging anything below 1.0 at the 20% completion mark
- Budget threshold alerts that notify PMs when a cost code exceeds a defined variance
- Labor productivity trend monitoring showing actual vs. budgeted hours per cost code, updated regularly
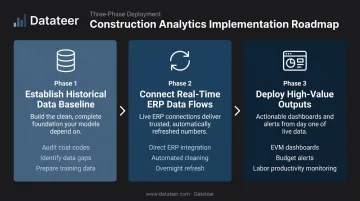
These outputs are achievable with existing ERP data and demonstrate ROI quickly. They also build the organizational habits that more sophisticated models depend on: reviewing forward-looking signals and acting on early warnings before they compound.
Frequently Asked Questions
What is predictive analytics in construction?
Predictive analytics in construction uses historical project data, statistical models, and machine learning to forecast future cost and schedule outcomes. It enables teams to identify potential overruns and act before they materialize — not at month-end close when the damage is done.
What is a mathematical model to help predict project costs?
Three primary models are used:
- Earned Value Management (EVM) — uses CPI and SPI as leading cost indicators from early in a project
- Regression analysis — predicts costs from patterns in historical cost-code data
- Monte Carlo simulation — models uncertainty across thousands of scenarios to produce a probability range of final costs
Which tool is best for predictive analytics in construction?
Predictive analytics requires two layers: a well-integrated construction ERP as the data source of record, and an analytics platform that automates extraction, standardization, and visualization. Purpose-built platforms like Datateer handle both layers — eliminating the 18-month build time and $500K+ cost typical of generic BI tools configured from scratch.
What are the most common causes of construction cost overruns?
The primary drivers are poor scope definition, delayed financial visibility from lagging WIP reports, labor productivity shortfalls, material price escalation, subcontractor underperformance, and change order creep. Predictive analytics closes the visibility and early-warning gaps that let these issues compound undetected.
How accurate is predictive analytics for construction projects?
Accuracy depends on data quality, historical depth, and model type. A 2025 peer-reviewed study on ML-based cost prediction reported an R² of 0.988 on 4,477 cost entries (a research result on clean, structured data — not a universal guarantee), and models improve further as more standardized project data accumulates.
How does predictive analytics differ from traditional cost estimating?
Traditional estimating is a point-in-time activity done before the project begins, based on unit costs and scope assumptions. Predictive analytics operates continuously throughout execution — updating forecasts as actual labor, material, and productivity data flows in, enabling mid-course corrections rather than only pre-project planning.