
Introduction
Construction firms today generate more data than ever — from ERPs, job cost reports, billing systems, and field platforms. Yet most finance teams are still making decisions from WIP reports that are 10 to 20 days stale, assembled through a grind of CSV exports, VLOOKUP formulas, and manual reconciliations.
The cost of that lag is real. According to KPMG's 2023 Global Construction Survey, 37% of capital projects missed budget targets by 20% or more — with ineffective risk management cited as the primary cause. By the time a budget overrun or margin fade surfaces in a monthly report, the window to act has already closed.
Business intelligence gives construction finance teams the visibility to catch problems while projects are still in progress — not after the damage is done. This guide covers:
- What construction BI is and how it differs from generic BI tools
- The five core components of a construction BI system
- Key benefits for finance teams and the KPIs that matter most
- Common implementation challenges and how to overcome them
- A practical framework for getting started
What Is Business Intelligence in Construction?
Construction business intelligence is the process of collecting, integrating, and transforming raw data from across a firm's systems — ERPs, project management platforms, field tools, billing modules — into actionable financial and operational insights that support timely decision-making.
How It Differs from General BI and Data Analytics
Generic BI tools like Tableau or Power BI aren't built for construction-specific data structures. Job costing, WIP accounting, and percentage-of-completion revenue recognition under ASC 606 require custom configuration that most horizontal platforms don't handle well out of the box.
Construction BI is also distinct from pure data analytics. Analytics focuses on statistical prediction. BI focuses on descriptive and diagnostic reporting — answering what is happening right now across projects and the business, then advancing toward predictive capabilities as data matures.
Why Construction Specifically Needs Dedicated BI
Three factors make generic tools insufficient for construction:
- Fragmented data sources — financial data lives in the ERP, project data lives in Procore or a similar platform, estimating often stays in spreadsheets, and payroll runs through a separate system
- Long project durations — financial health can deteriorate silently over months before a monthly close reveals it
- Invisible deterioration — an Autodesk/FMI report found that 30% of construction stakeholders said more than half of their project data was inaccurate, incomplete, or untimely, and about one-third reported bad data led to poor decisions
In that environment, firms operating without real-time intelligence are making decisions on data that's already stale — and often don't find out until the damage is done.
The Core Components of Construction Business Intelligence
Data Collection and ERP Integration
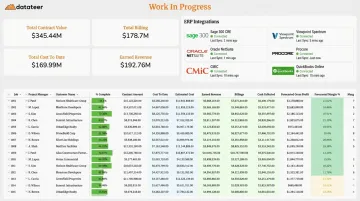
The foundation of any construction BI system is direct, automated connection to the firm's ERP. Manual CSV exports introduce delay and error — the exact problems BI is supposed to solve.
Purpose-built platforms like Datateer integrate directly with construction ERPs including Procore, Sage 100/300/Intacct, Viewpoint Vista, Viewpoint Spectrum, Acumatica Construction, Foundation Software, CMiC, Jonas Construction, QuickBooks, and NetSuite. Data syncs automatically overnight as standard, with more frequent updates available when needed.
Data Warehousing and Standardization
Raw ERP data is messy. Inconsistent cost codes, duplicate vendor records, unmapped fields, and non-standard chart of accounts structures across projects make cross-project analysis unreliable without a cleaning layer.
A centralized data repository that standardizes and reconciles this data automatically is what makes benchmarking, portfolio analysis, and accurate WIP calculations possible. That data integrity is the difference between reporting on noise and reporting on reality.
Analytics and Reporting Engine
With clean, standardized data in place, the analytics layer can do its actual job. Construction BI operates across three levels:
| Analytics Type | Question Answered | Example |
|---|---|---|
| Descriptive | What happened? | Job cost actuals vs. budget |
| Diagnostic | Why did it happen? | Where did labor costs spike? |
| Predictive | What will happen? | Projected final cost based on burn rate |
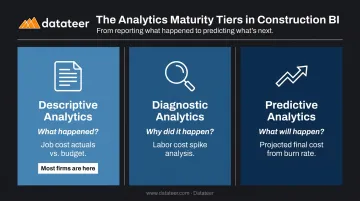
Most construction firms today only have access to descriptive analytics. Mature BI enables all three — and that progression is where the real financial value lives.
Visualization and Role-Based Dashboards
Once the analytics engine is running, how that data reaches decision-makers matters just as much. Different stakeholders need different views of the same data:
- CFO — portfolio-level margin, cash flow, and solvency
- Project manager — job-level cost performance, percent complete, change order status
- Controller — WIP schedule, billing position, AR aging
Static PDF reports and Excel exports are the legacy approach. Interactive dashboards — where each role sees what they need without reformatting anything — are the standard for BI-enabled firms.
Automated Monitoring and Alerts
BI systems can flag anomalies proactively rather than waiting for month-end to surface problems. Datateer's continuous margin monitoring tracks these signals in real time, so issues are caught while projects are still active:
- Labor budget overruns by job or crew
- Material price escalation against bid assumptions
- Subcontractor cost increases across the portfolio
- Change order denials creating unbilled exposure
- Cash flow thresholds approaching critical levels
Key Benefits of Business Intelligence for Construction Finance Teams
Eliminate the WIP Reporting Lag
The most immediate benefit for construction finance teams is replacing the 10-20 day WIP report preparation cycle with automated, always-current reporting. That cycle — pulling ERP exports, pasting into Excel templates, correcting formulas, chasing project managers for data — eats weeks of staff time every month.
One Datateer client, Double L Management, reported that "the very first time we accessed our data through a Datateer analytics dashboard, that one click replaced two weeks worth of prior work." That's not an edge case — it's a predictable outcome when manual assembly is replaced by direct ERP sync.
Catch Margin Fade Before It Becomes Margin Loss
Real-time job cost tracking and percent-complete monitoring let finance teams identify slippage — labor hours running over, subcontractor costs creeping up, scope changes not being billed — while there is still time to act.
The alternative is forensic accounting: discovering margin erosion at project closeout, when the only options left are to absorb the loss or dispute it. FMI's 2023 Labor Productivity Study found that contractors lost $30–$40 billion annually to labor inefficiencies, with 60% of respondents reporting more than 11% of field labor costs were wasted. Catching those overruns in week two rather than month six changes the outcome.
Bridge the Field-Office Data Gap
Without BI, version-control problems are endemic: the project manager has one cost number, the CFO has another from the ERP export, and the owner sees a third from a manually prepared report. Decisions get made from conflicting data.
When everyone works from the same live, reconciled numbers, conversations shift from "whose data is right?" to "what do we do about it?" The Procore-to-Sage reconciliation that used to require manual VLOOKUP work happens automatically — field and office see identical figures, in real time.
Transform the CFM from Data Gatherer to Strategic Advisor
When reporting is automated, construction finance managers stop spending the majority of their time assembling data and start spending it on analysis, forecasting, and advising. That shift shows up in what they can actually do for the business:
- Identify risk trends across the full project portfolio
- Flag underbilling exposure before it becomes a cash problem
- Model cash flow timing for a new project award
- Advise on go/no-go decisions with current margin data
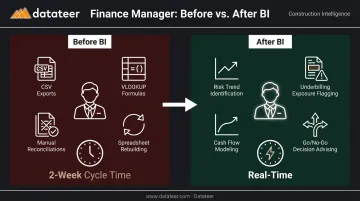
A CFM doing that work is far more valuable than one rebuilding the same spreadsheet every month.
Improve Cash Flow Visibility
Real-time overbilling and underbilling tracking, combined with AR aging and projected billing schedules, gives construction executives the visibility needed to manage liquidity, time draws, and line-of-credit usage deliberately rather than reactively.
Levelset's 2021 Construction Cash Flow and Payment Report found that cash flow problems reduce profits for 47% of construction businesses, delay projects for 33%, and force 30% to take out loans. Better visibility into billing position and retainage schedules directly reduces exposure to those outcomes.
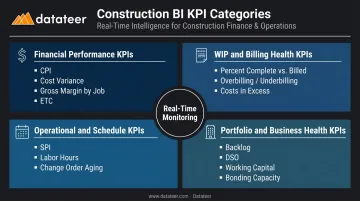
Essential KPIs to Track with Construction Business Intelligence
Financial Performance KPIs
Every construction BI dashboard should include:
- Cost Performance Index (CPI) — budgeted cost of work performed divided by actual cost. CPI below 1.0 signals the project is over budget relative to work completed
- Cost Variance (CV) — earned value minus actual cost, showing the dollar magnitude of cost deviation
- Gross Margin by Job — actual margin compared to estimated margin, tracked continuously
- Estimated Cost to Complete (ETC) — forecast of remaining cost, updated from current burn rates rather than original estimates
WIP and Billing Health KPIs
These metrics are invisible without dedicated BI because they require synthesizing data across accounting, project management, and billing modules simultaneously:
- Percent complete vs. percent billed
- Overbilling and underbilling position by job
- Revenue recognized vs. invoiced
- Costs in excess of billings / billings in excess of costs
Operational and Schedule KPIs
- Schedule Performance Index (SPI) — earned value divided by planned value
- Planned vs. actual labor hours by job and phase
- Subcontractor performance vs. committed scope
- Change order volume, approval rate, and aging by days since submission
Portfolio and Business Health KPIs
These are the metrics that surface only when BI aggregates data across every active project and job — invisible in any single project view:
- Total backlog and pipeline by project type
- Days Sales Outstanding (DSO)
- Working capital ratio
- Bonding capacity utilization
- Return on assets and equity
Across all four categories, the difference between a useful KPI and an ignored one comes down to frequency. A cost variance flag caught in week two can still redirect resources. The same flag in a month-end report is just a post-mortem.
Common Challenges When Implementing Construction BI
Data Fragmentation and Integration Complexity
Construction firms typically run multiple disconnected systems: - ERP for financials
- A separate platform for project management
- Spreadsheets for estimating
- Payroll software that connects to none of the above
Building custom integrations between these systems is technically complex and expensive.
Choosing a BI solution with pre-built connectors for major construction ERPs cuts this barrier considerably. Datateer, for instance, connects to 12+ construction ERPs out of the box — the difference between a 2-4 week implementation and a 6-18 month custom build often comes down to whether those integrations already exist.
Data Quality and Inconsistent Data Structures
Inconsistent cost codes, duplicate vendor records, manual journal entries, and non-standard chart of accounts entries across projects corrupt analytics outputs. In construction, that corruption is usually invisible until a WIP calculation surfaces the wrong number at the worst possible moment.
A data standardization and cleaning layer — not just a reporting layer on top of raw ERP data — is essential for trustworthy construction BI. This is different from general-purpose BI platforms, which typically pass data through as-is and leave cleaning to the user.
Organizational Adoption and Data Literacy
Technology alone doesn't create a data-driven culture. Project managers and executives need to trust the numbers before they'll change their workflows to act on them. That trust is earned through visible quick wins. When the WIP report that used to take two weeks appears automatically — and the numbers match what everyone was manually calculating — adoption follows naturally.
Starting with the most painful problem (usually WIP reporting) and demonstrating accuracy early is the most reliable path to firm-wide adoption.
How to Get Started with Business Intelligence in Construction
1. Define the specific problems you want BI to solve
Anchor the initiative to concrete pain points. Is the monthly WIP report consuming too much staff time? Are margin surprises showing up at project closeout instead of mid-project? Is cash flow visibility poor enough that you're managing the line of credit reactively?
The clarity of the goal determines the success of the implementation. "We want better data" is not a goal. "We want automated WIP reporting that eliminates our 15-day close cycle" is.
2. Evaluate solutions on construction-specific criteria
Key factors to assess:
- ERP integration depth — does it connect directly to your specific ERP, or does it require manual exports?
- Pre-built construction dashboards — starting from a blank canvas adds months to your timeline and shifts the burden to your team
- Data standardization capabilities — does the platform clean and reconcile data automatically, or does it require your team to fix inconsistencies first?
- Total cost of ownership — per-seat pricing and per-module fees add up quickly; flat annual pricing with unlimited users is more predictable
Datateer, for example, connects directly to 20+ major construction ERPs, delivers 12 pre-built financial dashboards on day one, and has a 2-4 week setup timeline — eliminating the implementation lag that stalls most BI projects. Pricing starts at $10,000/year per data source with unlimited users and no per-dashboard fees.
3. Start with financial reporting, then expand
Begin with automated WIP and job cost reporting before moving to operational and predictive analytics. Financial reporting delivers the highest immediate ROI, builds stakeholder trust in the data, and creates the clean data foundation that supports more advanced use cases.
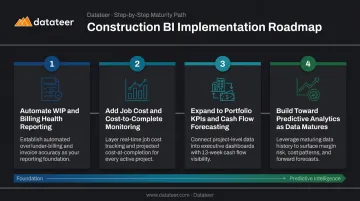
The sequence that works:
- Automate WIP and billing health reporting
- Add job cost and cost-to-complete monitoring
- Expand to portfolio-level KPIs and cash flow forecasting
- Build toward predictive analytics as data quality matures
Before committing to a platform, it helps to quantify what your current manual process is actually costing. Datateer's free Excel Tax Calculator estimates your firm's annual cost of manual reporting based on hours, staff count, and average salary — giving you a specific number to anchor the ROI conversation.
Frequently Asked Questions
What are the main components of business intelligence in the construction industry?
The five core components are: data collection and ERP integration, data warehousing and standardization, analytics and reporting engine, visualization and role-based dashboards, and automated monitoring and alerts. Each layer depends on the one before it — skipping standardization produces unreliable outputs; skipping monitoring leaves teams reacting to problems rather than catching them early.
What are the key KPIs for construction business intelligence?
The most critical KPI categories are financial (CPI, Cost Variance, Gross Margin by Job), WIP health (overbilling/underbilling, percent complete vs. percent billed), operational (SPI, labor productivity, change order approval rate), and portfolio-level metrics (backlog, DSO, bonding capacity utilization). Month-end KPIs matter, but continuously monitored KPIs are where BI pays off — they surface margin fade and cash shortfalls while there's still time to act.
How is construction BI different from general business intelligence?
Construction BI is built around job costing, WIP accounting, and ASC 606 revenue recognition — data structures that generic platforms like Tableau or Power BI require months of custom configuration to handle. Purpose-built platforms ship with pre-built dashboards mapped to construction-standard KPIs, so firms get actionable reporting on day one instead of starting from a blank canvas.
How long does it take to implement a construction BI solution?
It depends on the number of data sources and the solution chosen. Purpose-built platforms with pre-built ERP connectors and pre-configured dashboards — like Datateer — can have data flowing in 2-4 weeks. Custom-built solutions using horizontal BI tools typically take 6-18 months and require ongoing technical maintenance.
Can small and mid-size construction firms benefit from BI?
Mid-market contractors ($10M–$500M in revenue) often see the highest immediate ROI from BI because they lack the staff to sustain manual reporting processes indefinitely. Automated BI directly reduces labor costs tied to data assembly while improving the financial visibility that small teams need to manage risk across multiple projects simultaneously.