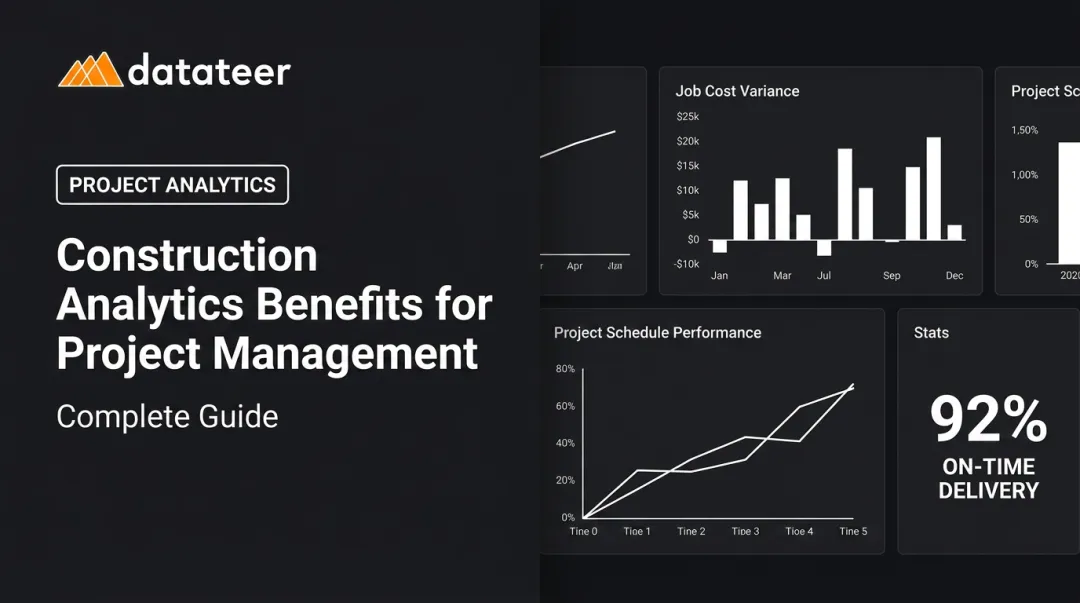
Introduction
By the time the WIP report lands on a construction finance manager's desk, the margin is already gone.
That's the uncomfortable reality for most construction firms. Problems that started in the field three weeks ago — a stalled submittal, slipping labor productivity on a key cost code, a change order backlog that doubled without warning — don't show up in financial reports until they've already compounded. The window to intervene has closed.
According to McKinsey, 98% of megaprojects suffer cost overruns of more than 30%, and the average cost increase reaches 80% of original project value. Even at smaller scales, the pattern holds: late information means late action.
Construction analytics software addresses this directly. Rather than describing what happened last month, it forecasts what's likely to happen next — pulling data from ERPs, job cost ledgers, and project management systems to surface warning signs while there's still time to act.
This guide covers what construction analytics software actually does, which leading indicators it tracks, and how to use that data to stop overruns before they become write-offs.
Key Takeaways
- Construction analytics software predicts cost overruns and schedule delays before they become unrecoverable.
- Traditional WIP reports describe the past; analytics software forecasts the future.
- Leading indicators like RFI volume, labor productivity variance, and change order aging are the real early-warning signals.
- Clean, ERP-connected data is the required foundation — manual spreadsheets corrupt every forecast downstream.
- Finance teams that adopt analytics shift from forensic accountants to strategic partners who can still fix problems.
What Is Construction Analytics Software?
Construction analytics software connects to your source systems — ERPs, job cost ledgers, project management tools — and pulls financial, project, and field data into a single platform. The output is dashboards and forecasting models that show where projects are heading, not just where they've been.
The distinction from standard project reporting matters. Traditional reports are descriptive: actual versus budget at a point in time. Analytics software is predictive — it surfaces patterns across cost codes, labor productivity, procurement timelines, and schedule logic to estimate the likelihood of future overruns or delays.
The Data Integration Problem It Solves
The KPMG 2021 Global Construction Survey found that only 16% of construction organizations had fully integrated systems and tools across operations, and just 6% had automated most business processes. A separate Dodge Construction Network study found 76% of general contractors reported data-integration challenges that directly impact budget control and cost predictability.
The result: finance teams spend most of their time assembling data instead of analyzing it. Analytics software inverts that ratio.
The platform maturity spectrum runs from automated dashboard reporting connected to ERP data through to AI-assisted risk scoring. But the foundation is identical in every case: clean, integrated data flowing directly from existing construction systems. Without it, even the most sophisticated forecasting models produce unreliable outputs.
Why Construction Projects Keep Overrunning — and Why Finance Teams Find Out Too Late
The Scale and Cascade of the Problem
Flyvbjerg et al. found that 86% of large transportation infrastructure projects experience cost overruns, with an average overrun of 28% in real terms. McKinsey's data on megaprojects puts average cost increases at 80% of original value.
Construction problems don't behave like isolated incidents. They cascade. A single delayed submittal approval can trigger a sequence that looks like this:
- Delayed material procurement
- Compressed trade installation windows
- Overtime premiums that weren't budgeted
- Reduced labor productivity across crews
- Final cost that bears no resemblance to the original estimate
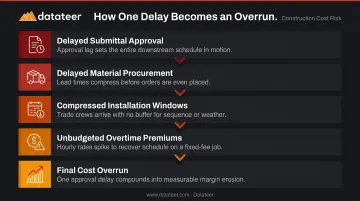
Catching the first link (a submittal stuck in review) is far cheaper than managing the downstream consequences.
The Reporting Lag That Makes Intervention Impossible
The CFMA's guidance on construction KPIs notes that pulling data from multiple systems is complicated and time-consuming, and recommends monitoring key indicators daily or weekly — not just monthly. That recommendation exists precisely because monthly reporting cycles create a structural lag between when problems emerge in the field and when finance teams can see them.
By the time an overrun appears in a WIP report, the conditions that created it are often weeks old. The margin hasn't just started fading — it's gone.
The Forensic Accounting Trap
Most construction finance managers recognize this situation: the majority of the month is spent reconstructing what happened — chasing spreadsheet inputs from field teams, reformatting cost reports, reconciling ERP exports — rather than analyzing what's likely to happen next. This reactive posture isn't a failure of the people doing the work. It's a structural failure of the reporting process itself.
The business stakes are direct. With Industrial and Nonresidential contractors averaging net income before tax margins of 4.4% in 2024 (per CFMA's 2025 Financial Benchmarker), a single project overrun can erase the profit from several completed jobs. That margin pressure doesn't stay on the income statement — it flows into liquidity, bonding capacity, and firm stability.
The Leading Indicators Construction Analytics Software Monitors
Leading indicators show conditions that predict future financial or schedule deterioration — before the outcome is locked in. Here's what analytics software tracks:
RFI Volume and Age
A rising count of open RFIs, combined with slow response turnaround times, signals unresolved design conflicts. A CMAA/Navigant study of 826 construction projects found the average project generated roughly 796 RFIs, with average first-reply time at 6.4 days and median answer time at 9.7 days. The study noted that an RFI raised when the issue is already at hand "almost certainly" results in delay.
Analytics software tracks RFI age trends across projects and flags when response times are trending in the wrong direction — giving teams time to escalate before procurement or installation windows compress.
Labor Productivity Variance
This is one of the most reliable early signals available. Analytics software compares actual labor hours and installed quantities against the planned production rates from the original estimate. A consistent gap between planned and actual productivity — even on a small percentage of cost codes — compounds quickly across large scopes.
A 5% productivity shortfall on MEP rough-in sounds manageable — spread across a $15M mechanical contract, it isn't.
Change Order Backlog and Aging
A growing backlog of unapproved change orders creates two simultaneous problems: cash flow pressure and cost forecast uncertainty. Work has been performed; payment is pending. Analytics software monitors change order aging and approval status, helping finance teams separate legitimate pending revenue from scope risk while there's still room to act on it.
Submittal Cycle Time and Procurement Risk
Extended submittal review cycles create downstream procurement delays, especially for long-lead materials. Analytics software tracks submittal pipeline status against procurement timelines and schedule logic, flagging activities at risk before they affect the critical path.
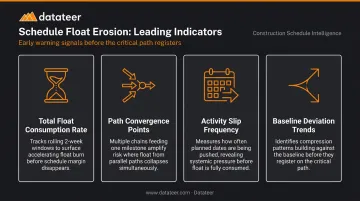
Schedule Float Erosion
A project can appear on schedule while near-critical activities quietly accumulate float erosion across the network. Analytics software tracks health indicators across the full network — not just the critical path. The key signals to watch:
- Total float consumption rate on near-critical activities over rolling 2-week windows
- Path convergence points where multiple near-critical chains feed a single milestone
- Activity slip frequency — how often planned start/finish dates are being pushed, even by small amounts
- Baseline deviation trends that show schedule compression building before it registers on the critical path
How Construction Analytics Software Forecasts Overruns and Delays
Step 1 — Connect and Standardize Source Data
Effective forecasting starts with pulling data directly from the ERP and project management systems the firm already uses — no manual exports, no copy-paste between spreadsheets. Cost code standardization across projects is essential here. Inconsistent coding makes historical comparison impossible and undermines every forecast downstream.
This is where many firms hit their first wall. With 49% of construction firms manually transferring data between non-integrated applications and 51% still using spreadsheets for accounting functions (per JBKnowledge's 2021 Construction Technology Report), the data foundation is often fragile before forecasting even begins.
Step 2 — Centralize Financial and Project Data
Once connected, analytics software creates a single source of truth by syncing:
- Job cost data and committed costs
- Change orders and labor actuals
- Schedule updates and WIP position
Finance teams get a current view of project health without waiting for month-end close. The reporting lag that delays intervention shrinks from weeks to hours.
Step 3 — Monitor Leading Indicators Continuously
With data flowing, the software tracks leading indicators on an ongoing basis — surfacing anomalies that a manual review would miss or catch too late:
- RFI response trends and submittal cycle times
- Labor productivity by crew and cost code
- Change order aging and approval status
- Float erosion on the schedule critical path
- Subcontractor performance against plan
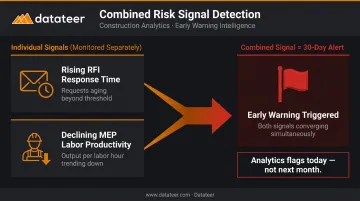
Consider a project where RFI response time doubles over two weeks while labor productivity on MEP rough-in drops below plan. Neither condition alone triggers a formal review.
Together, they signal a procurement and productivity problem that will surface in the cost report within 30 days. Analytics flags the combination today — not next month.
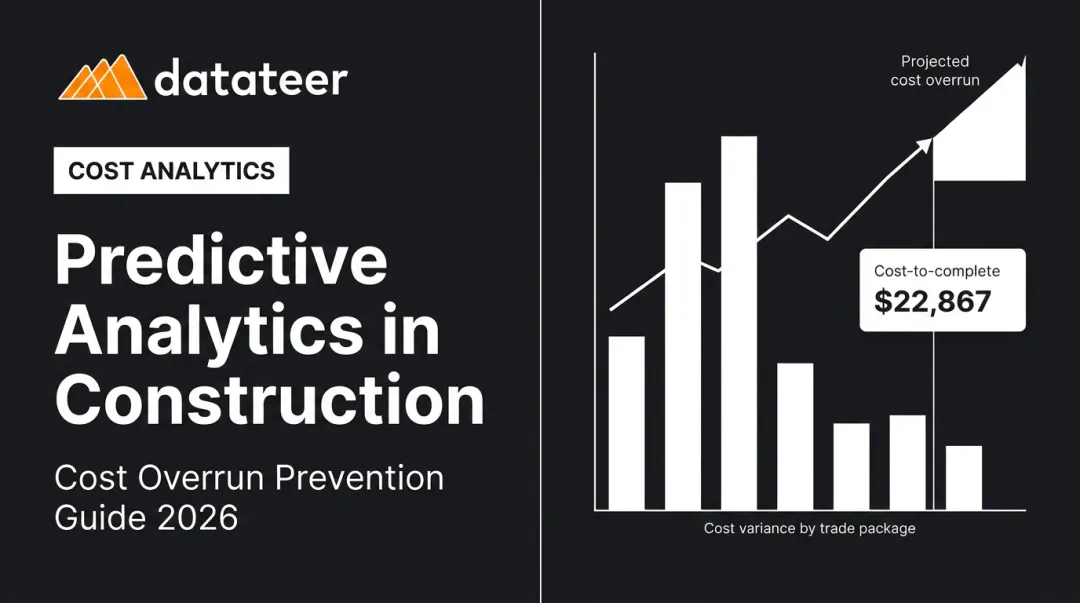
Step 4 — Apply Cost-to-Complete Forecasting
Analytics software uses actual cost data, productivity rates, and remaining scope to generate an updated cost-to-complete forecast — comparing it against the original budget and contract value. This is more reliable than manually estimated EACs because it's grounded in real production data, not assumptions carried forward from the original estimate.
Forecast quality depends entirely on input quality. Real production rates pulled directly from the ERP produce credible, defensible numbers. Spreadsheet-assembled inputs can look precise while carrying silent errors that only surface at project close.
Step 5 — Visualize and Communicate Risk
Dashboards translate forecast outputs into role-appropriate views:
- Executives see portfolio-level margin exposure and cash risk
- Project managers see job-level cost trends and schedule health
- Finance teams see WIP position, overbillings/underbillings, and cash flow projections
Walking into an owner meeting or a bonding review with current numbers tied directly to ERP actuals is a different experience than defending a static report from three weeks ago.
Step 6 — Act, Adjust, and Re-Forecast
The final step is the one that justifies the investment. Analytics software makes it possible to see the projected financial impact of interventions — resequencing work, adjusting crew size, accelerating submittals — before committing resources. Finance shifts from reporting function to strategic control — shaping outcomes rather than documenting them.
How Datateer Helps Construction Finance Teams Stay Ahead of Overruns
Datateer connects directly to 20+ construction ERPs — including Procore, Sage, Viewpoint Vista, Acumatica, Foundation Software, CMiC, and Jonas Construction — and automates the entire data flow from ERP to executive-ready dashboards. No manual exports. No reconciliation loops.
On day one, firms get 12 industry-standard dashboards across four strategic suites:
| Suite | Dashboards |
|---|---|
| Strategic Health | Return on Assets/Equity/Revenue, Forecasted Liquidity, Cash Conversion & Velocity |
| Cash Operations | AR & AP Health, WIP & Financial Truth, Job-Level Cash Flow |
| Field Performance | Project Cost Performance, Budget vs. Actuals, PM Scorecard |
| Resource Productivity | Labor & Materials Productivity, Subcontractor Performance, Equipment Utilization |
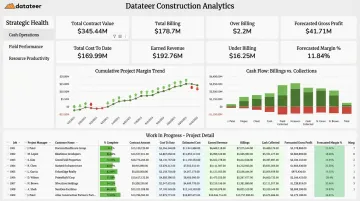
The WIP & Financial Truth dashboard covers both overbillings and underbillings, with data pulled directly from the ERP — live, clean, and reconciled automatically. A Business Analyst at Double L Management put it plainly: "The very first time we accessed our data through a Datateer analytics dashboard, that one click replaced two weeks worth of prior work."
Implementation takes 2–4 weeks, with data flowing before the annual fee begins. Pricing is flat — starting at $10,000 per year per data source with unlimited users and no per-seat fees. Datateer's roadmap is expanding from 12 to 50+ dashboards over the next 12–18 months, with early access included for existing clients at no additional cost.
Finance teams still grinding through spreadsheets at month-close can start with the 15-Minute Workflow Audit — a direct look at your current reporting process and what automated dashboards would look like against your actual ERP data.
Frequently Asked Questions
What is predictive analytics and forecasting for construction projects?
Predictive analytics in construction uses historical data, real-time field inputs, and statistical models to forecast outcomes like cost overruns, schedule delays, and labor shortfalls. The goal is to give project teams enough lead time to intervene before problems become unrecoverable. It supports human judgment rather than replacing it.
Which AI tool is used for predicting construction project timelines and optimizing scheduling?
Several platforms incorporate AI-assisted scheduling and delay prediction. McKinsey and ALICE Technologies, for example, partnered on generative AI scheduling that models what-if scenarios for contractors. The most reliable forecasts depend less on the AI label and more on the quality and consistency of project data feeding the model.
What are the early warning signs of a construction project cost overrun?
The key leading indicators are: rising RFI volume with slow response times, declining labor productivity versus the original estimate, a growing change order backlog, extended submittal review cycles, and schedule float erosion on near-critical activities. These show up weeks before the cost report does.
What data does construction analytics software need to forecast delays accurately?
Accurate forecasting depends on: standardized cost codes, current schedule data with maintained logic, daily field reports, RFI and submittal logs, change order records, and job cost data reconciled to the general ledger. Data quality matters as much as data volume. A large, inconsistent dataset produces unreliable forecasts regardless of the platform running the model.
How does construction analytics software integrate with existing ERP systems?
Most platforms connect via direct API integrations or automated data extracts, pulling financial, labor, and project data on a scheduled basis. This eliminates manual exports and keeps dashboards current. Datateer syncs overnight by default, with more frequent updates available when projects require tighter visibility.
Can smaller construction firms benefit from construction analytics software?
Yes. Firms at $10M in annual revenue benefit directly — particularly for WIP reporting accuracy and cash flow visibility. Cloud-based platforms with flat pricing have removed the enterprise IT investment that previously made analytics inaccessible at that scale. The cost of a single avoidable project overrun typically exceeds the annual cost of the software.