The result is predictable: finance managers re-entering data at 9 PM, WIP reports that are two weeks stale by the time anyone reads them, and project decisions made on numbers that no longer reflect reality. According to a 2018 PlanGrid and FMI report, construction professionals spend 35% of their time — roughly 14 hours per week — on non-productive activities, much of it chasing data that should already be available.
This guide covers the full construction tech ecosystem, explains where integration gaps cost real money, walks through how to build a connected stack, and shows how closing the financial data gap changes what construction finance leaders can actually do with their time.
Key Takeaways
- Integration connects field operations, project management, ERP, accounting, and analytics to eliminate data silos
- Disconnected tools create WIP reporting lags of 10–20 days, turning financial reports into forensic documents
- Manual data transfers accumulate hidden costs — version conflicts, broken formula chains, and margin visibility that's already two weeks stale by the time anyone sees it
- The most overlooked gap is the "last mile" between ERP data and executive-ready financial dashboards
- When that last mile is closed, finance teams shift from pulling numbers to acting on them — before a margin problem becomes a margin loss
What Is Construction Management Software Integration?
Construction management software integration is the process of connecting the digital tools a firm uses — ERP, accounting, project management, scheduling, payroll, field reporting, and analytics — so data flows automatically between them rather than being manually transferred.
Point-to-Point vs. Platform-Level Integration
Two distinct models exist, and the difference matters more than most firms realize:
- Point-to-point integrations connect two specific tools directly. Simple to set up, but they multiply quickly. Five systems can require ten separate connections, each one a potential failure point.
- Platform-level integrations use a central data layer that aggregates from multiple sources, standardizes the data, and distributes it consistently. This approach supports better data integrity and more reliable reporting across the organization.
For financial reporting specifically, platform-level integration is the only model that produces consistent numbers across systems — because it controls the transformation logic centrally rather than letting each connection handle it differently.
Why Construction Requires More Robust Integration
Construction is harder to integrate than most industries. Projects are temporary, involve multiple parties (owners, GCs, subs, suppliers), and carry financial complexity that generic business software wasn't built to handle:
- Percentage-of-completion accounting
- Change order tracking and approval workflows
- Retainage management across A/R and A/P
- Over/under-billing reconciliation
That complexity means data flows across more parties, more cost codes, and more systems than in almost any other sector. A cost code that means one thing in the ERP and something slightly different in the project management tool creates reconciliation work that repeats every single reporting cycle.
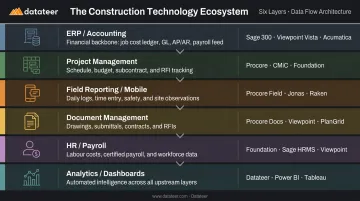
The Construction Technology Ecosystem: Key Systems That Need to Connect
A typical construction firm's tech stack spans six categories:
| Category | Role | Common Platforms |
|---|---|---|
| ERP / Accounting | Job cost, AP/AR, payroll, financial reporting | Sage, Vista, Acumatica, Foundation, CMiC |
| Project Management | Scheduling, RFIs, submittals, change orders | Procore, Autodesk Construction Cloud |
| Field Reporting / Mobile | Daily reports, timecards, inspections, safety | Procore, hh2, custom apps |
| Document Management | Drawings, specs, contracts, submittals | Procore, Autodesk Docs |
| HR / Payroll | Labor costs, compliance, benefits | Viewpoint, Jonas, QuickBooks |
| Analytics / Dashboards | Executive reporting, KPIs, WIP, cash flow | Datateer, Power BI, custom |
According to JBKnowledge's 9th Annual Construction Technology Report, 83% of construction firms use dedicated accounting/ERP software and 60% use dedicated project management software — yet integration between them remains one of the top IT challenges, cited by 28% of firms in the AGC/Sage 2025 Outlook survey.
The ERP as Financial Backbone
The ERP is where financial truth lives: job costs, subcontractor billing, change order approvals, procurement, payroll. When field costs flow automatically into the ERP, finance teams can see an accurate picture of where each job stands without manual consolidation. When they don't, the finance team becomes a data assembly operation — sorting through exports, fixing formulas, and chasing down cost codes instead of analyzing results.
The Analytics Layer: Most Commonly Skipped
Raw ERP data is transactional. It tells you what happened at the transaction level, not what it means for job profitability or company solvency. Turning that data into a WIP schedule, a cash flow projection, or a margin fade alert requires significant transformation work. Most firms still do that work manually in spreadsheets.
This is the layer most construction firms skip entirely — and it's where the highest concentration of manual labor concentrates. Purpose-built analytics platforms like Datateer connect directly to construction ERPs to automate this transformation, replacing weeks of spreadsheet work with dashboards that refresh overnight.
The Real Cost of Disconnected Construction Software
The Data Island Problem
When each tool holds its own version of project data with no automatic reconciliation, every reporting cycle requires manual assembly. An Autodesk and FMI 2021 study estimated that bad data cost the global construction industry $1.85 trillion in 2020, with $88.69 billion attributed to rework alone. The same study found that 30% of respondents said bad data led to poor decisions more than 50% of the time.
That same Autodesk/FMI research found 48% of all US construction rework — roughly $31.3 billion — was caused by poor data and miscommunication. The root issue isn't the software. It's the absence of integration connecting those systems to a single, reliable data flow.
The WIP Reporting Lag
The WIP report is construction finance's most critical document. It determines recognized revenue, flags over/under-billings, and gives leadership a view of margin per job. Without integrated data, producing it looks like this:
- Export cost data from the ERP manually
- Export project data from the project management system
- Reconcile cost codes between the two (often using VLOOKUP in Excel)
- Format the report per internal or bonding requirements
- Review, correct errors, and circulate — 10 to 20 business days after month-end
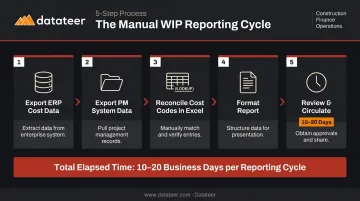
By the time that report lands in front of a CFO, the project conditions it describes have already changed. It's a forensic document, not a decision-making tool.
Double L Management, a Datateer customer, put it plainly: "That one click replaced two weeks worth of prior work."
Margin Fade Discovered Too Late
When job cost overruns aren't visible until month-end close, there's no window to intervene. Labor slippage, untracked change orders, and procurement overruns that show up in a report three weeks after the fact don't give project managers time to course-correct. The project is already deeper in the hole.
What disconnected systems do is delay visibility. By the time the numbers surface, the window to course-correct has already closed.
The Human Error Dimension
Manual data transfers introduce errors that distort financial reporting. Copying figures from an ERP into a spreadsheet, reconciling cost codes, and reformatting reports for different audiences each create opportunities for transcription mistakes and formula errors.
Research by Ray Panko found cell error rates between 1.1% and 5.6% in controlled experiments — and the risk scales with spreadsheet complexity. For a WIP report with hundreds of rows and multiple linked sheets, those odds compound fast.
How to Build a Well-Integrated Construction Tech Stack
Start With a Data Flow Map
Before evaluating any tool, map where data currently originates, where it needs to land, and where manual handoffs are happening today. Those handoffs are the integration opportunities. Common chokepoints include:
- Field timecards to payroll/ERP
- Procore change orders to accounting systems
- ERP cost data to executive dashboards and WIP reports
- Subcontractor invoices to AP and job cost
Every manual step in that map is a candidate for automation.
Evaluating Integration Compatibility
Not all integrations are equal. Key criteria:
- Native vs. API vs. middleware — native integrations tend to be more stable; API connections give more flexibility; middleware tools like iPaaS platforms bridge gaps but add complexity
- Real-time vs. batch sync — real-time is better for field operations; overnight batch is acceptable for financial reporting provided the sync runs consistently
- Data integrity controls — the integration must maintain consistent cost code mapping across systems, or reconciliation problems will reappear every cycle
- Number of integrations vs. data cleanliness — a firm with three clean, well-mapped integrations has better data than one with twelve that are loosely connected
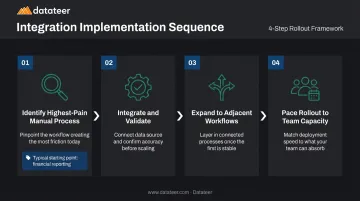
Sequence Your Implementation
Once you've selected tools that meet those criteria, the order of implementation matters as much as the tools themselves. Trying to integrate everything at once leads to adoption problems and data conflicts. A practical sequence:
- Identify the highest-pain manual process — for most firms, this is financial reporting or WIP preparation
- Integrate and validate — connect that system, confirm data accuracy against existing reports
- Expand to adjacent workflows — once the financial data layer is solid, extend to field-to-office and project management connections
- Pace the rollout to your team's capacity — each integration requires staff to learn new workflows; adding three systems simultaneously compounds adoption risk
From ERP to Executive Dashboard: Closing the Financial Data Gap
The Last Mile Problem
Even firms with a solid ERP face this: the data is all there, but it's in a transactional format that no executive can act on directly. WIP schedules, cash flow projections, labor productivity metrics, and margin fade alerts all require significant transformation before they're useful at the leadership level.
This transformation — extracting ERP data, standardizing cost codes, applying financial logic, and formatting the output — is work that most construction finance teams are still doing manually every month. It consumes the majority of a finance manager's working hours and leaves no time for analysis — the work that actually protects margins.
How Automated Financial Data Pipelines Solve It
An automated pipeline handles the extraction, cleaning, and formatting work that manual reporting requires. The output is a set of dashboards that reflect current data — not last month's — without anyone needing to run an export or open a spreadsheet.
Datateer is built specifically for this integration gap. The platform connects directly to 20+ construction ERPs and handles the data logic automatically:
- ERP connections: Procore, Sage 100/300/Intacct, Viewpoint Vista, Viewpoint Spectrum, Acumatica, Foundation Software, CMiC, Jonas Construction, and more
- Automated reconciliation: standardizes cost codes across systems and reconciles Procore project commits to Sage invoices without manual intervention
- Unified financial mapping: applies each firm's specific financial logic into a single consistent structure
- Implementation: 2–4 weeks, with data flowing before annual fees begin
- Pricing: starts at $10,000/year per data source — unlimited users, all dashboards, no hidden implementation fees
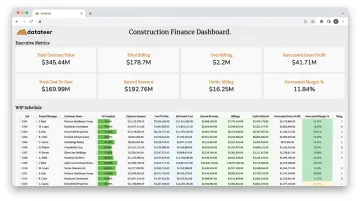
What Real-Time Financial Visibility Actually Enables
With data refreshing overnight rather than after a two-week manual cycle, construction finance teams can:
- Catch margin fade on active projects before it becomes unrecoverable
- Identify labor slippage the week it happens, not three weeks after payroll is cut
- Monitor cash conversion and flag receivables that are at risk of extending the cash cycle
- Walk into board meetings with current numbers rather than explaining why the data is from three weeks ago
Datateer's 12 pre-built dashboards cover all four dimensions of construction finance — executive solvency, cash operations, project performance, and resource productivity — and are fully mapped on day one. The platform is scaling to 50+ dashboards over the next 12–18 months, with existing clients receiving early access.
The Finance Manager's Role Shifts
When a construction finance manager spends 40 hours a month on manual reporting — exporting, reconciling, formatting — there's nothing left for analysis. Automated financial data pipelines don't just save time; they fundamentally change the role.
Instead of spending the bulk of each month gathering data, finance managers can spend it interpreting the data: flagging risks, advising project managers, contributing to decisions before problems become losses. The shift is from forensic accountant to financial partner.
Frequently Asked Questions
What software is used in construction management?
Construction firms typically use a combination of tools rather than a single platform: ERP/accounting systems (Sage, Vista, Acumatica), project management platforms (Procore, Autodesk Construction Cloud), field reporting apps, document management tools, and financial analytics dashboards. Most firms use at least three to six separate applications.
What are the most common project management platforms in construction?
Procore ranked #1 in the 2021 JBKnowledge Construction Technology Report with 39% adoption among respondents. Other commonly used platforms include Autodesk Construction Cloud, Viewpoint Team, Buildertrend (primarily for home builders), and Sage project management modules. Firm size, project type, and ERP compatibility all factor into the right selection.
How long does it take to integrate construction management software?
It depends on the systems involved and the complexity of data mapping. Simple point-to-point connections can be configured in days. Purpose-built ERP-to-dashboard pipelines, such as Datateer's, typically take 2–4 weeks from start to live data — including automated data extraction, cost code standardization, and dashboard configuration.
What is the most important integration for construction financial reporting?
The ERP-to-analytics integration delivers the most value for finance teams. It automates job cost, WIP, and cash flow data into decision-ready dashboards — eliminating the manual spreadsheet workflows that consume two or more weeks of finance team time each month.
How does ERP integration improve WIP reporting?
Direct ERP integration automates WIP data extraction, standardization, and formatting — cutting the typical 10–20 day manual reporting cycle to an overnight refresh. Finance managers get a live view of project profitability, over/under-billings, and margin trajectory instead of a historical snapshot that's stale before it circulates.