KPIs change that equation. They give project managers, CFOs, and finance teams a focused, real-time view of project health across cost, schedule, cash flow, safety, and labor — so problems surface while there's still room to act.
This post covers 8 construction KPIs every finance team should track, including formulas, benchmarks, and practical guidance on monitoring them without drowning in spreadsheets.
Key Takeaways
- Construction KPIs are quantifiable metrics tracking project performance across cost, schedule, cash flow, safety, and labor.
- This guide covers 8 high-impact KPIs spanning profitability, schedule, cash flow, labor productivity, safety, and receivables health.
- Tracking 6–10 high-impact KPIs outperforms monitoring dozens: focus on what directly drives profitability and on-time delivery.
- Real-time KPI tracking shifts teams from end-of-job forensics to proactive decisions that protect margins while projects are still running.
What Are Construction KPIs and Why Do They Matter?
Construction KPIs are quantifiable metrics used to evaluate project and company performance against set objectives. They span financial targets (profit margins, cost variance, cash flow), operational targets (schedule adherence, labor productivity), and compliance targets (safety incident rates).
The stakes are unusually high. Construction runs on thin margins — CFMA's 2025 Construction Financial Benchmarker reported FY2024 net income before taxes of just 6.7% for all respondents, with industrial and nonresidential contractors averaging only 4.4%. At margins that thin, even modest cost overruns can turn profitable-looking projects into losses.
Those thin margins have no buffer for surprises. McKinsey's analysis of 500+ capital projects found average cost overruns of at least 79% versus initial budget estimates, with average schedule delays of 52%.
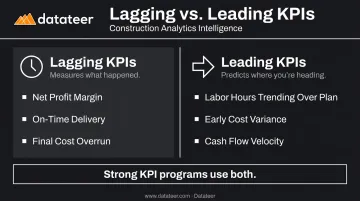
Leading vs. Lagging KPIs
KPIs fall into two categories with very different roles:
- Lagging KPIs measure outcomes that have already happened — net profit margin, on-time delivery, final cost overrun.
- Leading KPIs predict where things are heading — labor hours trending over plan, early cost variance, cash flow velocity.
Strong KPI programs use both. Lagging KPIs tell you what happened; leading KPIs give you time to change what's coming.
The 8 Key Construction KPIs for Measuring Project Success
These KPIs are selected for their direct link to project profitability, delivery performance, and financial health — relevant to both project managers in the field and CFOs overseeing the full portfolio.
KPI 1: Gross and Net Profit Margin
Formulas:
- Gross Profit Margin = (Revenue – COGS) ÷ Revenue × 100
- Net Profit Margin = (Revenue – COGS – Operating Costs – Interest – Taxes) ÷ Revenue × 100
Gross margin reflects project-level efficiency. Net margin reflects true company profitability after overhead, financing, and taxes. Both matter, but they answer different questions.
Gross margin tracked by project — not just company-wide — reveals which job types and clients are actually profitable versus which are steadily eroding margin. According to CFMA's FY2024 data, Specialty Trades reported a gross profit margin of 22.4%, while net income before taxes for Best in Class firms reached 12.0% compared to the industry average of 6.7%.
Datateer's Margin Protection module monitors original estimated margin versus current projected margin per job, flagging negative variance drivers including labor overrun, material escalation, subcontractor cost increases, and change order denials — before they compound.
KPI 2: Cost Variance and Cost Performance Index
Formulas:
- Cost Variance (CV) = Earned Value – Actual Cost
- Cost Performance Index (CPI) = Earned Value ÷ Actual Cost
A CPI below 1.0 means the project is running over budget. Above 1.0 means under budget. A CPI of 0.85, for example, means you're spending $1.00 for every $0.85 of work delivered.
The value of CPI isn't just knowing you're over budget — it's knowing where. Tracking cost variance at the scope, phase, cost code, or subcontractor level pinpoints exactly where the budget is bleeding. That granularity makes mid-project correction possible rather than post-closeout forensics.
Datateer's Cost Variance Reporting module tracks variance at job, phase, cost code, and resource type — labor, materials, subcontractor, overhead — in real time. From the dashboard, teams can drill down to source transactions in the ERP without leaving the view.
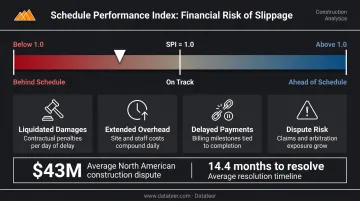
KPI 3: Schedule Performance Index (SPI)
Formula: SPI = Earned Value ÷ Planned Value
SPI below 1.0 means the project is behind schedule; above 1.0 means ahead. Unlike simple on-time/late tracking, SPI accounts for the cost of work completed relative to what was planned — a richer signal that connects schedule status to financial exposure.
Schedule slippage carries real financial consequences:
- Liquidated damages trigger once milestone deadlines pass
- Extended general conditions increase overhead burn
- Delayed milestones push payment receipt dates further out
- Construction disputes in North America averaged $43.0M in value in 2023, taking 14.4 months on average to resolve
Catching an SPI trending toward 0.85 on week four gives project managers time to compress the schedule, add resources, or renegotiate milestones before penalties apply.
KPI 4: WIP Schedule Accuracy
WIP (Work-in-Progress) reporting assesses the value of work completed versus billed. WIP schedule accuracy measures how closely the estimated percent-complete aligns with actual cost and billing data.
This is one of the most financially consequential KPIs in construction, and one of the least frequently updated. Many firms produce WIP reports monthly or less, leaving weeks of potential margin erosion invisible.
Why inaccuracy is dangerous:
- When percent-complete is overstated, revenue is recognized prematurely, inflating profit on the books
- By the time the true picture emerges at project closeout, correction is impossible
- Underbillings drain cash without warning; overbillings create future write-downs
CFMA notes that contractors should monitor WIP weekly — not monthly — to identify projects consuming cash before the damage compounds.
Datateer's WIP Reporting module automates the calculation of percentage complete, earned revenue, billed revenue, costs in excess of billings, and billings in excess of costs, pulling directly from the ERP overnight. The Double L Management team described their first experience with the platform: "That one click replaced two weeks worth of prior work."
KPI 5: Net Cash Flow
Formula: Net Cash Flow = Cash Inflows – Cash Outflows (over a given period)
A company can show strong profit margins while running short on cash. Construction's front-loaded cost structure — paying subcontractors and suppliers before owner payments arrive — creates persistent liquidity risk that income statements won't reveal.
Rabbet's 2024 Construction Payments Report found that slow payments cost the US construction industry $280 billion in 2024. CFMA reported average Days in Accounts Receivable of 55.2 days across construction firms in FY2024.
Finance teams need visibility into both actual and projected cash flow to act before gaps become crises. Key signals to track:
- Which projects are generating cash versus consuming working capital
- How retainage schedules affect liquidity timing
- Where burn rates are outpacing billing cycles
Datateer's 13-week cash flow forecasting pulls from real-time project burn rates and retainage schedules, giving finance teams advance warning of liquidity gaps at both the project and company level.
KPI 6: Labor Productivity (Planned vs. Actual Hours)
Formula: Hours Worked Variance = (Actual Hours – Planned Hours) ÷ Planned Hours × 100
A positive percentage means the project took longer than planned. Negative means faster. This can be tracked at the task, trade, or project phase level, giving estimators and project managers a feedback loop that sharpens both future bids and current execution.
Labor is typically the largest and most volatile cost component in construction. A 10% labor overage on a $5M project means $500,000 in unplanned cost — often invisible until payroll is processed weeks later.
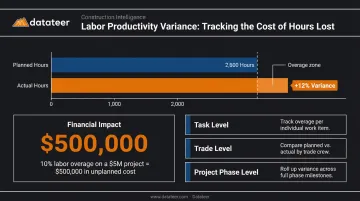
Datateer's Labor & Materials Productivity dashboards are designed specifically to surface this: spot budget blowouts on Tuesday instead of three weeks after payroll is cut.
KPI 7: Safety Incident Rate (TRIR)
Formula: TRIR = (Number of Recordable Incidents × 200,000) ÷ Total Hours Worked
The 200,000 constant represents the hours 100 full-time employees work in a year, making TRIR comparable across companies of different sizes.
The BLS reported a 2024 TRIR of 2.2 per 100 full-time workers for the construction industry (NAICS 23). That's the benchmark floor — high-performing firms should target meaningfully below it.
The financial case for tracking TRIR is direct:
- High incident rates increase insurance premiums
- Poor safety records disqualify firms from bidding on public contracts
- OSHA willful or repeated violations now carry penalties up to $165,514 per violation
- Incidents trigger project delays that compound into schedule and cost consequences
Datateer's PM Scorecards module includes safety incident rate as one of the objective dimensions tracked at the project manager level, connecting field safety performance to PM accountability reviews.
KPI 8: Accounts Receivable Turnover
Formula: AR Turnover = Net Credit Sales ÷ [(Beginning AR Balance + Ending AR Balance) ÷ 2]
Construction payment is slow by design. Retainage typically runs 5–10% of approved funds, pay-when-paid clauses push risk down the chain, and billing disputes delay receipt further. AR Turnover measures how efficiently the business is collecting what it's owed.
Low AR Turnover forces companies to finance operations out of pocket while waiting for payment. Tracking this KPI motivates faster billing cycles, tighter lien deadline management, and more proactive collections — all of which protect working capital.
Datateer's Cash Conversion & Velocity dashboards show exactly where money is getting stuck — from unbilled work to slow-paying owners — and days sales outstanding (DSO) is tracked as part of the platform's 50+ construction KPI library.
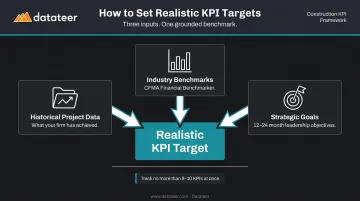
How to Set Realistic KPI Targets and Benchmarks
A KPI without a benchmark is just a number. Before measuring anything, establish what "good" looks like for your firm.
Use three inputs to set each target:
- Historical project data — what your firm has actually achieved across similar jobs
- Industry benchmarks — what comparable firms report (CFMA's Construction Financial Benchmarker is the most credible published source for US contractors)
- Strategic goals — where leadership wants the business to go in the next 12–24 months
Benchmark-Setting by KPI Type
| KPI Category | Benchmark Source |
|---|---|
| Financial (margins, cost variance) | CFMA benchmarks for your firm size and project type |
| Operational (labor hours, SPI) | Start with your own historical project data first |
| Safety (TRIR) | BLS published rates as a floor; set internal improvement targets year-over-year |
Don't track too many KPIs at once. CFMA recommends focusing on no more than 8–10 critical KPIs. Tracking more than that dilutes attention, creates reporting overhead, and means nothing gets acted on.
Start with the 6–8 KPIs most directly tied to your firm's current priorities — such as margin improvement, cash stability, or safety culture — and add more only once those are consistently monitored and driving decisions.
How to Track Construction KPIs Without the Spreadsheet Grind
The most common KPI tracking failure in construction finance is a data latency problem, not a strategy problem. KPIs calculated manually in Excel, pulling from multiple ERP exports, produce data that's 10–20 days old by the time it reaches decision-makers. By then:
- The cost overrun has compounded across another billing cycle
- The labor overage has widened through another week of payroll
- The WIP correction window has already closed
Dodge Construction Network found in 2023 that 53% of general contractors don't use a technology solution for the majority of their project management processes, relying instead on manual methods or spreadsheets — and 76% experience data integration challenges that affect project outcomes.
What Effective KPI Tracking Actually Requires
Useful KPI visibility requires two things working together:
- Direct ERP integration that pulls cost, payroll, billing, and WIP data automatically — no CSV exports, no manual reconciliation
- A reporting layer that refreshes overnight (or more frequently) and surfaces KPIs in dashboards finance teams can act on without reformatting
Datateer addresses both requirements directly. It connects to 12+ major construction ERPs — including Procore, Sage, Viewpoint Vista, Viewpoint Spectrum, Acumatica, Foundation Software, CMiC, Jonas, QuickBooks, and NetSuite — and delivers pre-built dashboards covering all 8 KPIs discussed here. Data syncs automatically overnight, so the numbers finance teams open on Monday reflect Friday's actuals, not last month's exports.
The practical outcome: finance managers stop spending their week formatting spreadsheets and start analyzing trends, flagging risks, and advising project managers. That shift from data gatherer to strategic partner only happens when the underlying data is current enough to act on.
Conclusion
Knowing where your jobs stand — on cost, schedule, cash flow, labor, and safety — is what separates firms that catch problems early from those that discover them at closeout.
The 8 KPIs in this post give finance teams and project leaders a focused lens for measuring what matters: margins at the job level, cost variance at the subcontractor level, WIP accuracy before closeout, and cash position before the liquidity crunch hits.
The real question is whether your current reporting stack supports that kind of visibility. If your WIP report is three weeks old and your cost variance tracking lives in Excel, your team is making decisions on data that no longer reflects the job.
Datateer connects directly to your ERP to automate construction financial reporting — making real-time KPI tracking the default rather than a manual effort. To see how it maps to your reporting workflow, reach out at hello@datateer.com.
Frequently Asked Questions
What is a KPI in construction?
A KPI in construction is a quantifiable metric used to measure how effectively a project or company is meeting its performance objectives. These metrics cover financial targets like cost variance and profit margin, operational targets like schedule adherence and labor productivity, and safety targets like incident rates.
What is an example of a KPI in construction?
Cost Performance Index (CPI) is a clear example. The formula is Earned Value ÷ Actual Cost — a CPI below 1.0 means the project is spending more than planned. Related financial KPIs include net profit margin, net cash flow, and WIP schedule accuracy.
How many KPIs should a construction company track?
Focus on 6–10 KPIs directly tied to the company's top business priorities. Tracking too many metrics dilutes focus, while too few leaves blind spots in cost, schedule, or cash flow. Start lean and expand only once the core set is consistently monitored and acted on.
What is the difference between leading and lagging KPIs in construction?
Lagging KPIs — like net profit margin or final cost overrun — measure outcomes that have already occurred. Leading KPIs — like labor hours trending over plan or early-stage cost variance — predict where performance is heading. Strong programs use both: one to track results, one to course-correct before they become results.
How do you set KPI benchmarks for a construction project?
Use a combination of your firm's historical project data, published industry benchmarks (CFMA's Financial Benchmarker is the most reliable US source), and internal strategic targets. Review and adjust benchmarks after each project as new data becomes available.
How often should construction KPIs be reviewed?
Review active project KPIs — cost variance, schedule performance, labor hours — weekly. Portfolio and company-level KPIs are best reviewed monthly. Real-time dashboards connected to ERP data make continuous monitoring possible, so critical signals don't wait for the monthly close.