Construction's financial structure makes this more complicated than most industries: mobilization costs hit immediately, billing cycles lag behind actual work, retainage locks up 5–10% of every contract, and margins leave almost no cushion for error. Working capital isn't just a balance sheet metric here. It's the difference between a firm that grows and one that quietly fails.
This guide covers how to calculate construction working capital, which metrics to track, why firms chronically struggle with it, and the strategies finance leaders use to protect it.
Key Takeaways
- Working capital = Current Assets − Current Liabilities; a ratio above 1.2 is the minimum healthy target for most construction firms
- The CFMA 2025 Benchmarker reports an industry-wide current ratio of 1.7, with Specialty Trades at 2.0 and Industrial/Nonresidential at 1.3
- Underbillings, overbillings, and retainage are construction-specific working capital components that don't exist in most other industries
- Slow collections are the primary working capital killer — fewer than 40% of contractors get paid within their stated 30-day terms
- Real-time WIP, AR aging, and cash visibility separates proactive management from financial firefighting
What Is Construction Working Capital?
Working capital (also called Net Working Capital, or NWC) is the difference between a company's current assets and current liabilities. It measures short-term liquidity: whether the firm can cover its near-term obligations without borrowing or selling long-term assets.
Formula: Working Capital = Current Assets − Current Liabilities
"Current" means items due within 12 months — making this a liquidity measure, not a profitability one. A company can be profitable and still run short on working capital.
Current Assets vs. Current Liabilities in Construction
Construction has asset and liability categories that don't exist in most industries:
Current Assets:
- Cash and cash equivalents
- Accounts receivable (billed, not yet collected)
- Underbillings (costs in excess of billings): work performed but not yet invoiced, classified as a current asset under GAAP
- Materials and inventory on-site
On the liability side, the picture looks like this:
Current Liabilities:
- Accounts payable (owed to suppliers and subs)
- Wages payable
- Overbillings (billings in excess of costs): invoiced ahead of work completed, classified as a current liability under GAAP
- Short-term debt obligations
Underbillings deserve special attention. They represent earned revenue that hasn't been invoiced yet — real money the firm has "spent" through labor and materials, but hasn't collected. A large underbillings balance can make a company look asset-rich while it's actually cash-starved.
The Working Capital Ratio
The companion metric is the working capital ratio (Current Assets ÷ Current Liabilities). A ratio above 1.0 means the firm can cover its near-term obligations; below 1.0 is a warning sign.
According to the CFMA 2025 Construction Financial Benchmarker, industry benchmarks by segment are:
| Segment | Current Ratio |
|---|---|
| All Construction Companies | 1.7 |
| Specialty Trades | 2.0 |
| Heavy Construction | 1.9 |
| Industrial & Nonresidential | 1.3 |
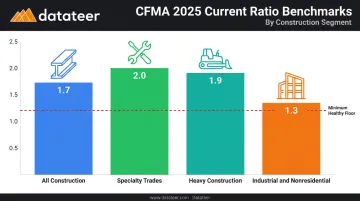
Most construction finance advisors recommend targeting at least 1.2 as a minimum floor. Smaller firms (under $50M revenue) typically carry higher ratios than larger ones, reflecting their thinner project pipelines and lower tolerance for cash shortfalls.
Why Working Capital Management Is Critical for Construction Success
Working capital is the operational engine that funds the gap between paying labor, materials, and subcontractors now and receiving payment from owners later (sometimes weeks, sometimes months out). Even a highly profitable firm becomes insolvent the moment current liabilities come due and liquidity runs dry.
Bonding Capacity
Surety companies assess adjusted working capital to set bonding limits. According to Dannible & McKee, bonding capacity generally ranges from 10 to 20 times a contractor's adjusted working capital. A firm with $2M in qualified liquid working capital can typically bond $20M–$40M in work.
Thin working capital doesn't just create cash stress — it caps growth. A contractor that can't demonstrate adequate working capital to a surety is locked out of larger contracts, regardless of how strong their backlog looks.
Borrowing and Credit Access
Bonding capacity is only one constraint. Lenders apply the same logic: working capital drives loan covenants and credit line sizing. Strong working capital unlocks larger facilities at better rates, while thin working capital pushes firms toward expensive short-term borrowing — raising overhead costs and eroding bid competitiveness as margins tighten.
Strategic Resilience
Firms with strong working capital can absorb:
- Contract delays and slow owner approvals
- Unexpected cost overruns mid-project
- Retainage holdbacks that tie up 5–10% of contract value
- Economic downturns that compress new work
Undercapitalized firms typically respond by "robbing Peter to pay Paul" — borrowing from one project's cash to fund another. The original liquidity gap doesn't close; it grows, and a single slow-paying owner can trigger a cascade across every active project.
Key Working Capital Metrics Every Construction Finance Leader Should Track
Current Ratio and Quick Ratio
The current ratio (Current Assets ÷ Current Liabilities) is the primary liquidity benchmark. The quick ratio strips out inventory and prepaid expenses, measuring only the most immediately accessible cash.
Per the CFMA 2025 Benchmarker, industry quick ratio benchmarks are:
| Segment | Quick Ratio |
|---|---|
| All Construction | 1.4 |
| Heavy Construction | 1.6 |
| Specialty Trades | 1.6 |
A CFMA article on construction financial health notes that quick ratios between 1.1 and 1.5 are generally considered ideal for contractors. A quick ratio below 1.0 means the firm can't cover immediate obligations without liquidating inventory or waiting on slower-moving receivables.
Working Capital Turnover Ratio
Working capital turnover = Net Revenue ÷ Net Working Capital. It measures how efficiently each dollar of working capital generates revenue.
The CFMA 2025 Benchmarker reports the industry average at 7.4 — consistent with the prior year's figure. For context, RSM data shows smaller firms (under $50M) average around 6.8, while larger firms (over $50M) run closer to 13.6, reflecting their higher capital velocity.
A very high ratio can signal undercapitalization. The firm may be generating revenue efficiently while carrying too little buffer to absorb a payment delay or unexpected cost overrun.
Days Sales Outstanding (DSO) and Billing Cycle Metrics
DSO measures how long it takes to collect receivables after billing. In construction, this number is painful: the Levelset/Procore 2022 Construction Cash Flow and Payment Report found average DSO of approximately 90 days across U.S. construction firms — despite nearly 90% of those firms offering payment terms of 30 days or fewer. Fewer than 40% were actually paid within their own stated terms.
Monitoring DSO alongside billing frequency gives finance leaders an early warning system. If progress billings are being submitted late, or collections are slipping beyond normal DSO, working capital pressure is building before it shows up as a cash crisis.
That gap between stated terms and actual payment is exactly where working capital crises start. Datateer's AR & AP Health dashboard addresses this with:
- DSO and AR aging surfaced in real time via direct ERP sync
- Overnight data refresh replacing the typical 10–20 day manual reporting lag
- AR aging tracked continuously across 0–30, 31–60, and 61–90 day buckets
- Visibility available any day of the month, not only at close
Why Construction Firms Chronically Struggle with Working Capital
The structural roots of working capital problems start at a firm's founding. Most construction companies begin small and closely held, resist outside equity, and operate on bid-driven margins that leave little retained capital.
As they grow and take on more concurrent projects, each new contract requires upfront cash before billing cycles generate any inflow — compounding the capital gap with every new award.
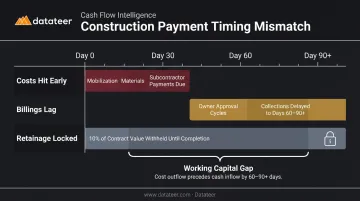
The timing mismatch is the core problem:
- Costs hit early: Mobilization, materials, and subcontractor payments are due in the first 30–60 days of a project
- Billings lag: Progress billing depends on owner approval cycles, retainage holdbacks, and pay-when-paid clauses that can push collections out 60–90+ days
- Retainage stays locked: The American Subcontractors Association reports that 10% retainage rates remain common, meaning up to 10% of every contract sits inaccessible until project completion. Levelset data shows 56% of subcontractors waited more than 60 days to collect retainage — and more than one-third of government contractors waited 90+ days
These pressures compound when firms respond reactively rather than systematically. Front-loading new project billings, extending supplier payment terms past agreed deadlines, or borrowing between jobs are common workarounds — but they mask the underlying problem while increasing financial risk across the portfolio. By the time a working capital crisis surfaces on a balance sheet, the project-level decisions that caused it happened weeks or months earlier — and without visibility into those leading indicators, there's no way to intervene in time.
Proven Strategies to Improve Construction Working Capital
Tighten Billing and Collection Cycles
Unbilled work only accumulates liabilities. Every day a progress billing sits unsubmitted is a day working capital shrinks.
Practical steps:
- Implement milestone-based or fixed monthly billing schedules and enforce them
- Track DSO by project and by owner — identify which clients consistently pay late
- Create written collection policies with defined reminder cadences at 30, 45, and 60 days past due
- Submit applications for payment on the earliest allowable date, not whenever the paperwork is convenient
Manage the Underbillings-to-Overbillings Ratio Strategically
Front-loading billings within contract terms improves cash position and provides a buffer against owner default. It's a legitimate cash management technique — but only when monitored carefully. Without job-level tracking, overbilling masks performance problems and creates a liability that has to be earned out in later phases.
The key is monitoring this ratio at the job level, not just company-wide. Datateer's WIP & Financial Truth dashboard automatically calculates costs in excess of billings (underbillings) and billings in excess of costs (overbillings) per project, surfacing aggregate portfolio figures — such as $16.25M in underbillings and $2.2M in overbillings — alongside job-by-job breakdowns.
Finance leaders can see exactly which projects are creating liquidity drag without manually reconciling spreadsheets.
Negotiate Supplier Terms and Use Financing Strategically
Widening the gap between cash out and cash in doesn't just happen on the collection side — it also happens on the payables side.
- Negotiate extended payment terms with key material suppliers and subcontractors
- Consider project-specific material financing to avoid depleting working capital on large material purchases
- Balance the carrying cost of debt against the working capital benefit — in a higher-rate environment, the math on short-term borrowing changes materially
Build a Dynamic Cash Flow Plan
A static cash flow snapshot reviewed once a month isn't a plan — it's a history lesson. Working capital management has to be forward-looking.
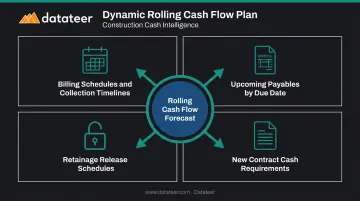
A rolling cash flow projection should incorporate:
- Current project billing schedules and expected collection timelines
- Upcoming payables by due date
- Retainage release schedules and overdue releases
- New contract commitments and their upfront cash requirements
Datateer automates this through its 13-Week Cash Flow Forecasting and Forecasted Liquidity dashboards, which pull directly from connected ERPs (Procore, Sage, Vista, Acumatica, and 12+ others) on an overnight data refresh. Finance teams get a continuously updated view of underbillings, overbillings, cash position, and margin trends across all active jobs — without rebuilding spreadsheets each week.
Protect Margins at the Job Level
Working capital erosion is often a symptom of margin fade on individual projects. Labor slippage, cost overruns, and change order delays drain cash reserves for weeks before the damage appears on a balance sheet.
Finance leaders need job-cost visibility at a granular level:
- Labor overruns against budgeted hours by cost code and phase
- Committed costs (POs, subcontracts) that haven't hit the income statement yet
- Stalled change orders where work has been performed but approval is pending
- Material price escalation against bid-estimate unit prices
Datateer's Margin Protection and Job Costing dashboards monitor all of these signals continuously, flagging margin fade in real time so both project managers and CFOs can act while there's still time to course-correct — not after the WIP period is locked in.
Frequently Asked Questions
What is a good construction working capital ratio?
A ratio above 1.2 is generally the minimum healthy target. The CFMA 2025 Benchmarker puts the industry average at 1.7 overall, with Specialty Trades averaging 2.0 and Industrial/Nonresidential at 1.3. Smaller firms typically carry higher ratios than larger ones given their thinner project pipelines.
What are the three types of working capital in construction?
The three types are permanent working capital (baseline minimum to operate), temporary working capital (added capacity during peak project activity), and reserve working capital (the buffer for unexpected costs or downturns). Most firms underinvest in reserve working capital until a cash crisis forces the issue.
How do I calculate construction working capital?
Working Capital = Current Assets − Current Liabilities. Include underbillings (costs in excess of billings) as a current asset and overbillings (billings in excess of costs) as a current liability — both are construction-specific. The working capital ratio (Current Assets ÷ Current Liabilities) is the companion metric that benchmarks your position against industry standards.
What is the difference between working capital and cash flow?
Cash flow measures the actual movement of money in and out of the business day-to-day. Working capital is a snapshot of the gap between short-term assets and short-term liabilities. Strong working capital doesn't guarantee positive cash flow — if collections are slow or billings are delayed, the firm can have solid working capital on paper while running dangerously low on actual cash.
How do underbillings and overbillings affect working capital?
Underbillings reduce working capital by creating an uncollected receivable — the firm has spent the cash but hasn't invoiced for it yet. Overbillings temporarily boost working capital but represent a liability that must be earned out. Tracking both at the job level is the only reliable way to assess true working capital health.
What are the biggest working capital challenges for construction contractors?
The core challenges are the timing mismatch between upfront costs and delayed collections, retainage holdbacks that lock up 5–10% of contract value, slow-paying owners (fewer than 40% of contractors get paid within their own 30-day terms), and slim margins. Growth compounds the problem — each new contract demands more upfront cash before billings generate inflows, widening the working capital gap faster than revenue grows.