Introduction
Most construction firms aren't short on data. They're short on the right data, reviewed at the right time, by the right people.
Finance teams export CSVs from their ERP, wrestle those files into Excel, and spend hours reconciling numbers before a board meeting — only to present figures that are already two to three weeks old. Meanwhile, a job that was bid at 18% gross margin is quietly closing at 11%, and nobody caught it until the project was done.
Most firms track dozens of metrics across disconnected spreadsheets — with no clear system for turning those numbers into decisions. Research from FMI and PlanGrid found that poor data and miscommunication drove 48% of U.S. construction rework, costing more than $31.3 billion annually.
Only 18% of surveyed firms consistently used mobile tools to access project data.
This guide covers:
- The four categories of construction KPIs
- The financial metrics that matter most to CFOs and finance managers
- How to build a tracking system that actually drives action
- What a real construction KPI dashboard should look like
Key Takeaways
- Construction KPIs fall into four categories: financial, operational, safety, and quality — each targeting a different management level.
- Financial KPIs (WIP, CPI, gross margin, DSO) are the highest-leverage metrics for protecting firm profitability.
- KPIs are only useful when reviewed on the right cadence — weekly for active projects, monthly at the portfolio level.
- A real construction KPI dashboard pulls directly from your ERP, surfaces exceptions automatically, and gives every stakeholder one source of truth.
What Are Construction KPIs (and Why Most Firms Track Them Wrong)
Before building any KPI system, the distinction between a metric and a KPI matters more than most finance teams realize.
A metric is any measurable data point you can pull from your system. A KPI (Key Performance Indicator) is a strategically selected metric tied to a specific business outcome — with an owner, a target, a review cadence, and a defined response when it crosses a threshold.
"Number of RFIs submitted" is a metric. "Change order rate as a percentage of total contract value" is a KPI. The first tells you something happened; the second tells you whether your estimating and field communication are creating financial risk.
The Four Types of KPIs
Most construction firms operate at only one level of KPI sophistication:
| KPI Type | What It Does | Example |
|---|---|---|
| Descriptive | What happened | Final job cost vs. budget |
| Diagnostic | Why it happened | Labor overrun by cost code |
| Predictive | What will happen | Cost-to-complete variance trending |
| Prescriptive | What to do | Escalate job to PM review before month-end |
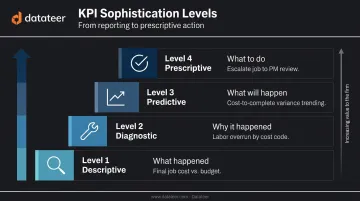
The majority of construction finance teams spend most of their time at the descriptive level — reviewing completed projects. The highest-value work happens at the predictive and prescriptive levels, where there's still time to act.
The Common Failure Mode
A 50-metric dashboard nobody acts on causes the same problems as tracking nothing at all. When every number looks equally important, nothing gets prioritized — and overruns that should have triggered action get buried in the noise.
The firms that get the most value from KPI programs typically track 10–15 metrics with:
- A named owner for each KPI
- A defined threshold that triggers a response
- A consistent review cadence (weekly, monthly, or by project phase)
- A documented action protocol when the threshold is crossed
Datateer's construction KPI library covers 50+ industry-standard metrics, but the platform is built around this same principle — surfacing the KPIs relevant to each decision-maker rather than presenting every available data point on a single screen.
The Four Categories of Construction KPIs
A complete KPI framework covers four domains: Financial, Operational, Safety, and Quality. Most firms over-index on operational metrics (schedule, labor hours) and under-invest in financial KPIs — which is exactly where margin is won or lost.
Financial KPIs
Financial KPIs connect project activity to profitability. Without them, operational metrics give you speed without direction.
Key financial metrics to track:
- Cost Performance Index (CPI): CPI = Earned Value ÷ Actual Cost. A value below 1.0 means you're spending more than the work is worth — a direct margin leak.
- Gross margin by project and phase: Tracks whether estimated margin is holding as work proceeds, not just at closeout.
- Billing efficiency (overbilling/underbilling rate): Measures how closely billings track actual progress — chronic underbilling is a cash flow warning sign.
- Cost-to-complete variance: Compares original estimates to revised projections, flagging jobs where the final number is drifting.
- Cash flow vs. forecast: Tracks whether actual cash receipts and disbursements are tracking the 13-week projection.
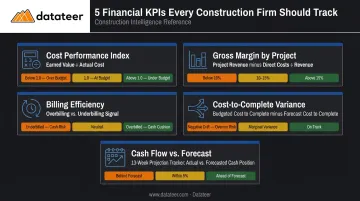
Financial KPIs are the early warning system that operational metrics alone can't provide. A project running at SPI 1.05 can still finish underwater if CPI has been drifting below 0.90 for two months.
Operational KPIs
Key operational metrics every project team should monitor:
- Schedule Performance Index (SPI): SPI = Earned Value ÷ Planned Value. A value above 1.0 means you've earned more value than planned; below 1.0, you're behind schedule. PMI cautions that SPI above 1.0 doesn't guarantee critical-path health — procurement delays, inspections, and change orders can distort the picture.
- Labor productivity: Hours per unit of output, tracked at the crew and phase level.
- Equipment utilization rate: Which assets are earning their keep versus sitting idle.
- Resource utilization rate: What percentage of your available workforce is billable on active jobs.
- Project completion percentage: Earned value as a share of total contract value.
Operational KPIs are the most visible metrics to project managers, but without linking them to financial outcomes, they tell only half the story. A project can be "on schedule" while quietly bleeding margin — and SPI won't surface that on its own.
Safety KPIs
Safety metrics are leading indicators of organizational risk, not just compliance obligations.
The Total Recordable Incident Rate (TRIR) formula:
(Number of recordable incidents × 200,000) ÷ Total hours worked
The 200,000 factor represents 100 full-time employees working 40 hours per week for 50 weeks. BLS 2024 data shows TRC rates by segment:
| Segment | 2024 TRC Rate |
|---|---|
| Construction overall | 2.2 |
| Nonresidential building | 1.9 |
| Heavy and civil engineering | 1.8 |
| Specialty trade contractors | 2.3 |
Beyond TRIR, track these two supporting metrics:
- Lost Time Injury Frequency Rate (LTIFR): Captures incidents severe enough to pull workers off the job — a more sensitive signal than TRIR alone.
- Safety Training Compliance %: Tracks whether crews are current on required certifications before incidents happen.
A declining TRIR trend has direct financial impact. A single $50,000 injury claim can raise your Experience Modification Rate (EMR) by 15 points, increasing annual premiums by $24,000 — and that higher rate persists for three years, totaling $72,000 in added costs.
Quality KPIs
Quality problems are almost always symptoms of upstream failures: poor planning, miscommunication, or insufficient subcontractor oversight.
Key quality metrics:
- Defect rate: Defects ÷ total units inspected × 100
- Rework cost as % of project budget: The Construction Industry Institute reports rework typically costs 2%–20% of contract value on a given project
- Punch list completion rate: Tracks how quickly open items are resolved at project closeout
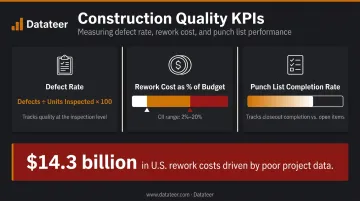
The downstream cost is significant. FMI and PlanGrid found that poor project data drove $14.3 billion in U.S. rework costs in 2018. When rework rates spike, the root cause is rarely quality control alone — it traces back to design gaps, coordination breakdowns, or change orders that proceeded before resolution.
The Financial KPIs Construction Finance Managers Must Monitor
Financial KPIs are where a construction CFO earns their impact. They're the difference between discovering a problem at month-end close and catching it while there's still a path to intervention.
WIP Over/Under Billing
Work-in-Progress reporting is the foundational financial KPI for construction. The WIP schedule reconciles job cost, billings, and recognized revenue. The over/under billing position on each job tells you whether revenue recognition is running ahead of or behind your cost curve.
- Overbilled (billings in excess of costs): Revenue recognized ahead of work completed, signaling inflated short-term revenue that may need to reverse.
- Underbilled (costs in excess of billings): Work completed but not yet billed — a cash flow risk often tied to unapproved change orders. CFMA notes that approved but unbilled change-order work is a common source of underbillings on the WIP schedule.
WIP cannot be owned by accounting alone. A project manager's judgment about cost-to-complete, change order status, and field conditions directly affects recognized margin. When PM estimates are stale, the WIP is wrong, and so is every financial report built on top of it.
Cost Performance Index (CPI)
CPI = Earned Value ÷ Actual Cost
A CPI below 1.0 means you're spending more than planned for the work completed. Track this job by job, not just at the portfolio level. A strong portfolio average can hide one project steadily eroding firm-level profitability without surfacing in aggregate numbers.
Datateer's Job Costing & Cost-to-Complete module surfaces CPI at the job, phase, and cost-code level , so you can investigate exactly where cost is running away before the project closes out.
Gross Margin by Job and Margin Fade
Aggregate margin is nearly useless as a management tool. What matters is margin by:
- Job type (GC work vs. design-build vs. subcontract)
- Project manager
- Customer segment
Margin fade is one of the most destructive patterns in construction finance: a job bid at 18% gross margin closes at 10–12% because of labor slippage, change order disputes, and material overruns that went undetected mid-project. FMI's research identifies change orders priced below original contract margin and direct cost overruns as the primary drivers.
The Datateer Margin Protection dashboard flags negative variance drivers (labor overrun, material price escalation, subcontractor cost increases, and change order denial) in real time during the project, not at closeout.
Cash Flow and DSO
Days Sales Outstanding (DSO) = Accounts Receivable ÷ Credit Sales × Days in Period
A rising DSO trend signals billing delays or client disputes that erode working capital. CFMA notes that commercial construction payments can average up to 90 days, making DSO monitoring non-negotiable for any firm managing tight liquidity.
Also track backlog ratio (total backlog ÷ monthly revenue), which tells leadership how many months of work are in the pipeline. A shrinking backlog is a leading indicator of revenue risk before it shows up in the income statement.
Bid-to-Win Ratio and Estimate Accuracy
Firms that consistently win below their target margin threshold have a problem that starts in pre-construction, not the field. Recommended tracking:
- Bid-to-win ratio by project type and estimator
- Estimated vs. actual cost variance by trade category, to identify systemic estimating gaps
- Win rate at target margin vs. wins below threshold, to distinguish pricing discipline from competitive pressure
If your concrete work consistently runs 12% over estimate, that's a data pattern, not bad luck. AACE's estimate classification guidance makes clear that accuracy depends on scope maturity, which makes early-stage estimates inherently wider and more prone to overrun if not updated as scope firms up.
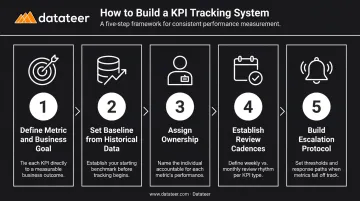
How to Build a Construction KPI Tracking System That Actually Works
A KPI system is only as good as its implementation. Most fail not because of bad metric selection, but because of poor structure around ownership, cadence, and escalation.
The Five-Step Framework
- Define the metric and tie it to a business goal — "Track CPI" is not a KPI objective. "Identify projects with CPI below 0.95 before they exceed budget" is.
- Set a baseline from historical data before establishing targets — don't guess at what "good" looks like.
- Assign ownership — each KPI needs a named person accountable for reporting it and acting on it.
- Establish review cadences — weekly for active project KPIs (SPI, labor productivity, safety), monthly for portfolio-level financial KPIs (WIP, margin by job, DSO).
- Build an escalation protocol — when a KPI crosses a threshold, define the response in advance: who acts, how fast, and what changes.
The Spreadsheet Problem
The most common implementation failure: collecting KPI data in disconnected spreadsheets. When finance teams manually export data from ERPs, reformat it in Excel, and distribute reports two to three weeks later, those KPIs reflect history — not current reality.
This is especially damaging for WIP and margin tracking, where a two-week lag means decisions get made on data from projects that have already moved. Double L Management's Business Analyst described the shift directly: "The very first time we accessed our data through a Datateer analytics dashboard, that one click replaced two weeks worth of prior work."
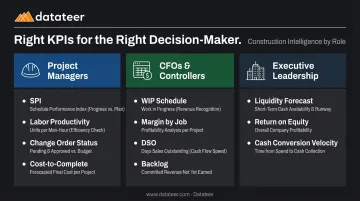
Role-Differentiated Reporting
Fixing the data lag is step one. Step two is making sure the right numbers reach the right people. A monolithic dashboard that tries to serve every role serves none well:
- Project managers need job-level operational data — SPI, labor productivity, change order status, cost-to-complete.
- CFOs and controllers need portfolio-level financial KPIs — WIP schedule, margin by job, DSO, backlog.
- Executive leadership needs company-wide solvency signals — liquidity forecast, return on equity, cash conversion velocity.
Datateer organizes its dashboards into four strategic suites — Executive Strategy & Solvency, Financial Operations & Cash Management, Project Excellence & Field Operations, and Resource Productivity — so each stakeholder gets a focused view of the numbers that drive their decisions, without wading through data built for someone else's role.
What a High-Value Construction KPI Dashboard Looks Like
An effective construction KPI dashboard has three defining characteristics:
- Updates automatically from the ERP — not through manual data entry or CSV exports
- Surfaces exceptions and variances rather than forcing users to hunt for problems
- Serves a specific decision layer — executive, PM, or field supervisor
CFO Dashboard vs. PM Dashboard
| Dashboard Layer | Key KPIs |
|---|---|
| CFO / Executive | WIP over/under billing by job, gross margin by PM, cash flow with DSO trend, backlog by month, CPI by active job |
| Project Manager | SPI, labor productivity, equipment downtime, change order rate, cost-to-complete variance |
These serve entirely different decisions. Giving a PM an executive cash flow view — or a CFO a field productivity feed — creates noise, not clarity.
The Real Cost of Static Reporting
When role-specific dashboards depend on manual data pipelines, that layered structure breaks down fast. Firms relying on monthly PDF reports or emailed Excel files carry a structural visibility problem: by the time a WIP report reaches the CFO through a traditional manual workflow, the data reflects decisions made two to three weeks earlier. That lag doesn't just slow reporting — it leaves margin problems undetected until it's too late to act.
Datateer's construction intelligence platform addresses this directly, integrating with 12+ major construction ERPs — including Procore, Sage, Viewpoint Vista, and Acumatica — so WIP reports and financial KPI dashboards refresh automatically overnight. Flat annual pricing starts at $10,000 per year per data source, with unlimited users and a 2–4 week implementation timeline.
What to Avoid in a KPI Dashboard
- Exceeding 12–15 KPIs per view causes decision fatigue — more data is not more insight
- Showing a gross margin figure without a trend line or benchmark gives no signal on whether to act
- Requiring human data entry means the dashboard will fall behind and eventually stop being trusted
Frequently Asked Questions
What are examples of good KPI dashboards for construction?
A CFO-level dashboard covers WIP over/under billing by job, gross margin by PM, cash flow with DSO trending, backlog by month, and CPI. A PM-level dashboard focuses on SPI, labor productivity, change order rate, and cost-to-complete variance. Both work best when they pull automatically from the ERP with no manual input.
What are the most important financial KPIs for construction companies?
WIP over/under billing, Cost Performance Index, gross margin by job, DSO, backlog ratio, and cash flow from operations are the core six. Tracked together, they cover both profitability and liquidity — tracking only profitability without liquidity, for instance, can mask a cash crisis behind healthy margins.
What is the difference between a construction metric and a KPI?
A metric is any measurable data point. A KPI is a strategically selected metric tied to a specific business goal — with an owner, a target, and a defined response when it moves in the wrong direction. All KPIs are metrics, but most metrics aren't KPIs.
How often should construction KPIs be reviewed?
Active project KPIs (SPI, labor productivity, safety incidents) warrant weekly review; portfolio-level financial KPIs are typically reviewed monthly. Automated dashboards make continuous monitoring practical, so critical metrics don't have to wait for a fixed review date.
How do you calculate the Cost Performance Index (CPI)?
CPI = Earned Value ÷ Actual Cost. A value above 1.0 means the project is delivering more earned value than the cost incurred — it's under budget for work completed. Below 1.0 signals cost overruns that need investigation at the job, phase, and cost-code level.
What KPIs should a construction CFO focus on?
WIP schedule accuracy, gross margin by job and PM, cash flow from operations, DSO, backlog coverage ratio, and bid-to-actual cost variance form the core portfolio. These KPIs are most actionable when pulled directly from the ERP, so the CFO is working from current data rather than last month's close.