Why Construction Risk Assessment Fails Without the Right Data
Most construction firms have risk assessment processes. Risk registers get filled out, pre-construction meetings happen, financial reports get reviewed. The problem isn't the absence of risk management — it's that the data powering those assessments is weeks old by the time anyone acts on it.
According to KPMG's 2023 Global Construction Survey of 267 construction leaders, 37% missed budget or schedule targets by 20% or more due to ineffective risk management, and only 50% of project owners reported their projects finished on time. These aren't firms that skipped risk management — they're firms that executed it on stale information.
Traditional risk assessment depends on manual data gathering, lagged financial reports, and judgment calls made without current project data. By the time a margin problem shows up in a monthly WIP report, the project has often moved past the point where corrective action is affordable.
This guide covers five risk categories data analytics can expose, the techniques used to detect them, and the financial signals that matter most. The goal: build a risk process that catches problems while there's still time to fix them — not after the damage is done.
Key Takeaways
- Data analytics shifts construction risk management from reactive to predictive — catching budget overruns, labor slippage, and schedule deterioration before they become unrecoverable.
- The five key risk categories — financial, schedule, safety, environmental, and contractual — each require different data inputs and analytical approaches.
- WIP accuracy, margin fade, and cost-to-complete variance are the most valuable early warning indicators for construction finance teams.
- Clean, automated ERP data is the foundation — manual or lagged data creates dangerous blind spots when it matters most.
- Automated financial dashboards eliminate forensic accounting and shift teams to real-time risk management.
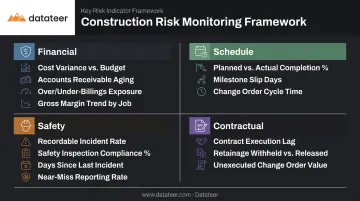
The 5 Key Construction Project Risk Categories Data Analytics Can Expose
Effective risk assessment requires mapping risks across distinct categories, each with its own data signatures, rather than treating all project risks as a single undifferentiated mass.
Financial Risks
Cost overruns, billing variances, budget mismanagement, and cash flow disruption are among the most consequential risk types in construction, and they're directly measurable through financial data.
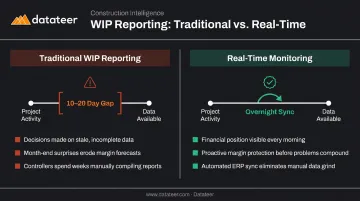
The challenge: these risks are often hidden by delayed WIP reporting cycles and manual spreadsheet processes that introduce a 10–20 day lag between conditions on the ground and data available for decisions.
CFMA identifies cash flow as the number one cause of contractor failure. Subcontractors waited an average of 56 days for payment in 2025, and 43% lacked sufficient working capital for unexpected expenses or project delays, per Construction Dive's reporting.
Schedule Risks
Schedule deterioration compounds financial exposure over time. Every week of delay adds overhead costs, extends resource commitments, and erodes negotiating position.
What makes this particularly costly: schedule deterioration typically appears in the data weeks before it surfaces as a formal issue. Without systematic monitoring, those early signals go unread.
Labor availability is a major driver. The AGC's 2024 Workforce Survey found 54% of construction firms experienced project delays due to worker shortages, with 94% reporting open craft positions that were difficult to fill.
Safety and Environmental Risks
Construction workers represent 7.5% of employment but accounted for 19.9% of all fatal work injuries in 2022, according to CPWR data. In 2024, BLS reported 1,032 fatalities in construction and extraction, with falls, slips, and trips the leading cause.
The 2023 Dodge/CPWR Safety Management report found 76% of contractors gathered safety data, but only 53% used it effectively. Historical incident pattern analysis — tracking near-misses, OSHA citations, and unsafe condition reports over time — shifts safety management from reactive incident response to preventive intervention.
Contractual and Quality Risks
Incomplete scope, design errors discovered mid-build, ambiguous contract language, and rework are invisible until they become disputes. Arcadis reported the average North American construction dispute value reached $60.1M in 2024, up 40% from $43M in 2023, with errors or omissions in contract documents named as the leading cause for the third consecutive year.
These risks are traceable through RFI log volume, change order frequency and aging, and rework rates — all data points that exist in project management systems but rarely get systematically monitored.
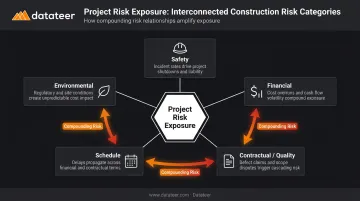
Why These Categories Can't Be Managed in Silos
Financial, schedule, and contractual risks compound each other. A scope change that should generate a change order instead becomes an undocumented cost. That undocumented cost creates labor overrun. The labor overrun shows up as margin fade weeks later. A siloed view of any one category underestimates total project exposure.
Cross-category analytics — tracking how RFI volume trends correlate with change order aging and cash flow impact simultaneously — is what separates reactive reporting from genuine risk management.
Core Data Analytics Techniques for Construction Risk Assessment
Descriptive Analytics and Historical Benchmarking
Descriptive analytics examines past project performance to establish baselines: what did similar projects cost, how long did they take, where did overruns most commonly occur? These benchmarks make current project deviations meaningful. Without a baseline, a 5% cost variance looks the same whether it's normal noise or the start of a serious overrun.
Every completed project is a data asset. Firms that capture structured data consistently — by project type, size, geography, and contract type — build a benchmarking library that makes risk scoring progressively more accurate.
Predictive Analytics and Pattern Recognition
Predictive analytics uses historical patterns to forecast the likelihood of specific risks materializing. A project with a particular combination of contract type, complexity, and subcontractor concentration may correlate strongly with cost overruns in historical data — making that combination a flag on new projects before anything goes wrong.
KPMG found that only 4% of construction firms apply AI across all projects, though 37% had begun adopting it. That gap represents a significant competitive window: firms capturing clean, structured project data today will have the training data to run meaningful predictive models tomorrow.
Qualitative vs. Quantitative Risk Analysis
These two approaches serve different purposes:
- Qualitative analysis uses probability-impact matrices to prioritize risks based on expert judgment — fast to execute, broadly applicable, and effective for most projects
- Quantitative analysis uses statistical modeling (Monte Carlo simulation being the most common) to generate probabilistic cost and schedule outcome distributions — resource-intensive but valuable on large, complex projects
Most construction firms use qualitative analysis as their primary tool. Quantitative methods, guided by frameworks like AACE's Professional Guidance Document No. 02, are typically reserved for high-value or high-complexity projects where the investment in statistical modeling is justified.
Real-Time Monitoring and Early Warning Indicators
The standard WIP reporting cycle introduces a 10–20 day lag between what's happening on a project and the data available for decisions. During those two to three weeks, critical signals go unseen by the finance team:
- Margin erosion from untracked cost creep
- Labor hours accumulating against a stale budget
- Billing positions shifting without updated WIP
Real-time monitoring changes this by continuously tracking data from ERPs and financial systems, surfacing risk signals as they emerge rather than waiting for the next monthly close. Platforms like Datateer eliminate this lag by syncing directly from construction ERPs (including Procore, Sage, Vista, and Acumatica), refreshing data overnight so finance teams see current positions each morning.
Critical Financial Risk Signals Every Construction Firm Should Monitor
These are the specific metrics that function as early warning indicators for construction project risk. They only become actionable when the underlying data is clean, current, and flowing directly from the ERP.
WIP Report Accuracy and Overbilling/Underbilling
The WIP schedule is the primary financial risk lens on active projects. Two conditions signal trouble:
- Overbilling (billings in excess of costs): Inflates perceived cash position and masks upcoming exposure. Work billed hasn't been earned yet, creating collection risk if the project underperforms.
- Underbilling (costs in excess of billings): Work performed without billing recovery. Often signals unapproved change orders, billing process failures, or scope creep that hasn't been captured.
WIP data that's two to three weeks old cannot flag either condition in time to act. Datateer's platform displays the billed-versus-earned position daily, replacing the month-end WIP marathon with an automated calculation that updates overnight from the ERP.
Margin Fade and Cost-to-Complete Variance
Margin fade, where project profitability erodes gradually across the project lifecycle, is one of the most dangerous financial risks in construction because it's rarely visible until closeout under traditional reporting methods.
The key metric is cost-to-complete variance: the gap between estimated and actual remaining costs. When this number trends unfavorably over multiple reporting periods, the project is on a margin fade trajectory.
Identified early, margin fade is correctable through scope adjustments, change order recovery, crew redeployment, or renegotiation. At closeout, those options are gone.
Datateer's Margin Protection module monitors original estimated margin against current projected margin per job, flagging variance drivers at the cost code level while corrective action is still possible:
- Labor overruns against budgeted hours
- Material cost escalation
- Subcontractor cost increases
- Denied or unrecovered change orders
Labor Slippage and Productivity Tracking
Labor slippage (actual hours exceeding budgeted hours without proportional output) is both a cost risk and a schedule risk indicator, and one of the earliest signals available because labor costs accumulate daily.
Tracking actual versus budgeted labor at the cost code level identifies underperforming activities before they compound. As McKinsey's 2024 analysis showed, U.S. construction productivity had negative 2% annual growth from 2000 to 2021 — meaning labor risk is a structural industry problem, not a project-by-project anomaly.
Cash Flow and Liquidity Risk Signals
Key cash flow indicators to monitor continuously:
| Metric | What It Signals |
|---|---|
| Current ratio (target >1.25) | Near-term liquidity position |
| Quick ratio (target >1.0) | Ability to cover obligations without inventory |
| Cash-to-overbillings (target >1.0) | Whether billed-ahead cash is actually available |
| Days sales outstanding (DSO) | Speed of billing-to-collection cycle |
| Retainage aging | Locked capital approaching release eligibility |

Construction firms managing multiple active projects need portfolio-level cash flow visibility, not just project-level snapshots. Datateer's 13-week cash flow forecasting projects working capital requirements based on real-time project burn rates and retainage schedules, identifying which projects are cash generators and which are consuming liquidity before that imbalance becomes a crisis.
Building a Data-Driven Construction Risk Assessment Process
Step 1: Establish Clean Data Infrastructure
Data-driven risk assessment fails when built on unreliable inputs. The foundation requires:
- Direct ERP integration that eliminates manual data exports
- Standardized cost codes mapped consistently across projects
- Automated data flows that remove manual entry errors and formatting inconsistencies
Datateer's implementation handles this automatically — reconciling Procore project commits to Sage invoices, standardizing cost codes, and flagging malformed entries before they reach dashboards. The typical setup runs 2–4 weeks, with data flowing before annual fees begin. Traditional BI implementations commonly take 6–18 months — and still produce unreliable outputs.
Step 2: Build and Maintain a Living Risk Register
The risk register is the central tool — but only if it's treated as a living document. Each entry should include:
- Risk description and category
- Probability and impact scores
- Assigned risk owner
- Response plan and trigger conditions
A risk register completed at kickoff and never updated is a compliance artifact, not a management tool. Review it at each schedule update, after scope changes, and whenever key indicators deteriorate: WIP variance, cost-to-complete trend, or change order aging.
Step 3: Define Key Risk Indicators and Monitor Continuously
Each risk category requires specific, measurable indicators with defined acceptable ranges:
- Financial: WIP accuracy, margin fade rate, cost-to-complete variance, DSO
- Schedule: Schedule Performance Index (SPI) trend, float consumption rate
- Safety: Recordable incident frequency, near-miss rate, OSHA citation history
- Contractual: Change order approval rate, aging, RFI volume and response time
Define thresholds at project kickoff so deviations trigger review automatically. Datateer's KPI Library includes 50+ pre-configured construction metrics pulled directly from ERP data, so teams don't need to rebuild these calculations manually each month.
Overcoming the Real Barriers to Construction Risk Analytics
Data Quality and Standardization Problems
Fragmented data — spread across spreadsheets, disconnected software systems, and inconsistently coded cost structures — is the most common barrier to reliable risk analytics. When data has to be manually reconciled before analysis can begin, the lag is inevitable and the error rate is high.
Automated ERP integration with standardized data extraction removes this barrier. It replaces the manual reconciliation cycle with a direct, validated data flow. Specifically, it eliminates:
- Manual CSV exports and VLOOKUP reconciliation
- Dependency on any one team member's spreadsheet setup
- Data integrity gaps that compound over project lifecycles
Resistance to Change and Culture Gaps
Moving from intuition-based risk management to data-driven processes requires real leadership commitment, not just a software purchase. The most effective framing: data analytics supports experienced judgment rather than replacing it. When project managers trust the numbers because the data is clean and current, they engage with dashboards as decision tools rather than resisting them as oversight mechanisms.
Presenting specific wins early — "we caught this margin fade six weeks before closeout" — builds credibility faster than any training program.
Starting Small: The Right Entry Point
Firms new to data-driven risk management get faster traction by focusing adoption energy on one area first. For most construction firms, that means **financial risk monitoring via WIP and margin tracking** — the highest-impact use case with the clearest ROI signal.
From there, expand to schedule analytics, labor productivity, portfolio-level cash flow, and subcontractor performance. Build data discipline in one area first, then expand. The move from spreadsheets to automated dashboards doesn't require changing every process at once. Starting at $10,000/year per data source with unlimited users, Datateer's flat pricing structure makes this incremental approach financially straightforward.
Frequently Asked Questions
What is the role of data analytics in construction risk management?
Data analytics enables construction teams to identify risk signals — cost overruns, schedule deterioration, labor slippage — earlier than traditional reporting allows. Rather than discovering problems at monthly close or project completion, analytics surfaces them while corrective action is still possible.
What types of construction project risks can data analytics help identify?
The five main categories are financial, schedule, safety, environmental, and contractual/quality risks. Each requires different data inputs: financial risks need WIP and cost data; safety risks need incident logs and leading indicators; contractual risks need change order and RFI data.
How is predictive analytics used in construction risk assessment?
Predictive analytics uses historical project data to identify patterns associated with cost overruns, delays, or safety incidents. By mapping those patterns to characteristics of current projects — size, complexity, contract type, subcontractor concentration — teams can flag high-risk conditions before they materialize.
What financial data should construction firms monitor for early risk detection?
The most critical indicators are WIP accuracy, margin fade rate, cost-to-complete variance, labor productivity by cost code, and cash flow against projected obligations. Track these continuously against project baselines — deviation in any one of them is typically the first visible sign of financial trouble.
What is the difference between qualitative and quantitative risk analysis in construction?
Qualitative analysis uses probability-impact matrices and expert judgment to prioritize risks, and works well for most projects. Quantitative analysis applies statistical modeling (Monte Carlo simulation, for example) to estimate the probability distribution of cost and schedule outcomes. It's typically reserved for large or complex projects where that precision justifies the effort.
How do construction firms get started with data-driven risk assessment?
Start by establishing clean, automated data flows from your ERP. That foundation has to be solid before anything else works. Then identify the highest-impact risk category to monitor first — usually financial, via WIP and margin tracking — and build from there rather than attempting everything at once.