Introduction
Picture this: it's the night before a stakeholder meeting, and your finance team is still pulling CSV exports from Sage, running VLOOKUPs in Excel, and reconciling Procore data by hand. By the time the report lands on the executive's desk, the numbers are already 10–20 days old.
This isn't a personal failure — it's an industry-wide structural problem. According to the Autodesk/FMI survey of 3,916 construction stakeholders, North American management staff spend 40% of their time collecting, analyzing, and reporting data. Meanwhile, only 5% of firms report that all their software applications integrate with each other.
Business intelligence (BI) in construction is the process of automatically aggregating financial and operational data across your entire firm — ERP, project management, field reports — and turning it into financial signals your leadership can act on immediately.
This guide covers what construction BI is, why the data problem is so persistent, how BI applies across key finance functions, and what to look for when choosing a platform.
Key Takeaways:
- Manual reporting consumes up to 40% of construction management time; BI reclaims it
- Disconnected systems (ERP, PM software, spreadsheets) create dangerous data lag for WIP and cash flow decisions
- Purpose-built construction BI delivers pre-built dashboards for WIP, job cost, and cash flow without months of setup
- Catching budget overruns early drives the primary financial ROI, not cost reduction
- Purpose-built platforms go live in 2–4 weeks; generic BI tools take months
What Is Business Intelligence in Construction?
Construction BI is the systematic collection, integration, and analysis of data from across a firm's operations — ERP, project management software, field reports, payroll — to generate insights that drive faster, better decisions. The key word is integrated. Simply having data across multiple systems is not business intelligence. BI means that data is connected, cleaned, and presented in a format decision-makers can act on without a data engineer in the room.
BI vs. Data Analytics: A Practical Distinction
These terms often get conflated, but the difference matters in practice:
- Business intelligence answers "what happened" and "how are we tracking versus budget" — it's descriptive by design
- Data analytics goes further, asking "what is likely to happen" and "where are the risks"
Most modern construction platforms combine both. Your WIP dashboard tells you where you are today (BI); a trend line showing margin fade trajectory over the last six weeks is analytics.
Why Construction Is Uniquely Difficult
Construction finance is more data-intensive than almost any other industry — and harder to get right manually. Four structural reasons drive that complexity:
- A single bad data month on a multi-year project can quietly compound for 18 months before anyone notices the damage
- Cost code structures vary by project, division, and estimating system — manual reconciliation introduces errors at every step
- Larger firms with multi-entity structures need financial consolidation across separate legal entities, adding another layer of reconciliation
- WIP percentage-complete calculations require field and accounting data to be in sync at the same moment
Manual processes applied to these conditions don't just create reporting lag — they obscure the project-level signals that determine whether a firm finishes the year profitable or not.
Why Construction Finance Data Is Such a Mess
The Disconnected Systems Problem
Most construction firms run three to five separate systems that don't naturally talk to each other: an ERP like Sage or Vista, a project management platform like Procore, a payroll system, subcontractor portals, and a collection of spreadsheets filling the gaps.
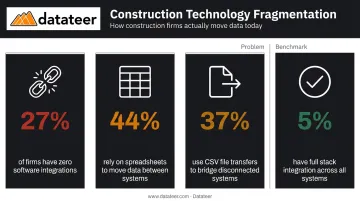
JBKnowledge's construction technology survey found that 27% of firms have no software integrations at all, while only 5% have full integration across their stack. Nearly 44% use spreadsheets to move data between systems, and 37% rely on CSV file transfers. That's the reality behind most construction financial reports.
The Spreadsheet Treadmill
Here's how the cycle typically plays out:
- Finance pulls a CSV export from the ERP
- Data gets reformatted in Excel — VLOOKUP, manual cost code mapping, formula repairs
- The spreadsheet gets emailed to the executive team
- By Wednesday's meeting, the data is already a week old
- Repeat next month
The time cost is substantial. The Autodesk/FMI research puts management-level data work at 40% of total working hours — a figure that becomes more alarming when you consider that these are your highest-paid operational staff.
What Lagged Data Actually Costs
Operating on stale or siloed financial data creates specific, measurable risks:
- Budget overruns caught too late — by the time the overrun shows up in a manual report, the window to renegotiate subcontracts or adjust crew sizes may have closed
- Overbilling and underbilling exposure — EisnerAmper links WIP reporting errors to reduced bonding capacity, while NASBP flags underbillings as a direct surety and cash flow risk
- No cross-project comparison — without an integrated view, a finance manager can't see that three of seven active jobs are running over on labor simultaneously
The Field-Office Divide
Project managers in the field track cost and progress in one system. The finance team works from a delayed snapshot of that same data — often reconciled manually weeks later. The result is two versions of reality running in parallel: field teams make decisions without current cost data, and finance teams approve budgets without current field context.
That gap has a real cost. Finance leaders buried in data gathering can't flag a margin problem until it's already compounded across three jobs — by which point the corrective window has closed.
Key Applications of Business Intelligence in Construction
WIP Reporting and Over/Under Billing
WIP reporting is where manual construction finance is most painful, and where BI delivers the most immediate value.
A BI platform connected directly to your ERP can automate the entire WIP schedule, pulling percentage complete, billed-to-date, earned revenue, and cost-to-complete without a single CSV export. What that produces is a real-time view of every job's billing position:
- Overbilling (billings in excess of costs) — a liability that affects bonding capacity and creates legal exposure if the project underperforms
- Underbilling (costs in excess of billings) — a cash drain that CFMA explicitly warns contractors to monitor because those jobs are consuming working capital
Catching these monthly (or more frequently) gives finance teams the ability to course-correct billing before it becomes a surety issue. Datateer's WIP & Financial Truth dashboard does exactly this, pulling directly from connected ERPs to replace what typically requires two weeks of manual reconciliation work.
Job Cost Tracking and Margin Fade Detection
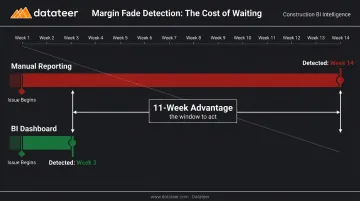
Margin fade (the gradual erosion of project profit between bid and close-out) is one of construction's most preventable losses. It typically goes undetected until close-out because no one is watching cost codes across all active jobs simultaneously.
BI dashboards change this by surfacing estimated vs. actual costs at the cost code level across every active project in a single view. When labor on a mechanical scope is running 15% over budget on Job A, you see it in week three, not week fourteen.
Datateer's Job Costing & Cost-to-Complete analytics tracks actual costs, committed costs (POs and subcontracts), pending change orders, projected final cost, and budget variance at the job, phase, and cost code level — automatically reconciled from the ERP and project management system.
Cash Flow and Liquidity Forecasting
Rabbet's 2024 Construction Payments Report found a 57-day average payment cycle and estimated slow payments cost the US construction industry $280 billion in 2024. With 71% of subcontractors reporting delayed payments from general contractors, cash position is never static.
BI platforms address this by aggregating AR aging, retainage schedules, and project burn rates into a projected cash position, giving CFOs a forward-looking view rather than a historical one. Datateer's 13-week cash flow forecasting uses real-time project burn rates and retainage schedules to project working capital needs, flagging potential shortfalls before they require emergency credit draws.
Labor Productivity and Executive Portfolio Views
Beyond billing and cash, two more BI applications directly affect how construction firms manage capacity and make decisions at the top.
- Labor productivity analysis: Compares budgeted versus actual hours by trade, crew, or project — identifying inefficiencies while there's still time to reassign resources or renegotiate scope
- Executive portfolio dashboards: Shows all active jobs' gross margin, WIP position, and liquidity status in a single view, rather than requiring leadership to review one project report at a time
Datateer's Executive Strategy & Solvency suite delivers this portfolio view through Return on Assets/Equity/Revenue, Forecasted Liquidity, and Cash Conversion & Velocity dashboards — available on day one.
The Real Benefits of Construction Business Intelligence
Time Reclaimed from Manual Reporting
The most immediate benefit is time. Datateer's Excel Tax Calculator quantifies this directly: a team spending 40 hours per month on reporting with two staff members at $46/hour accumulates an annual Excel Tax of $43,846. That figure exceeds the cost of a BI subscription for most mid-size construction firms.
One Double L Management finance team member reported that the first time they accessed data through a Datateer dashboard, "that one click replaced two weeks worth of prior work."
When reporting is automated, finance teams stop being data assemblers and start being strategic advisors.
Margin Protection Through Early Visibility
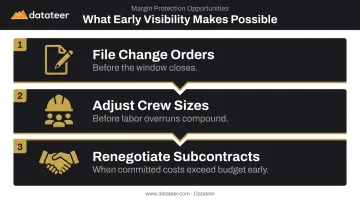
The primary financial ROI of construction BI is not cost reduction — it's catching problems while there's still something you can do about them. That means:
- Filing change orders before the window closes
- Adjusting crew sizes before a labor overrun compounds
- Renegotiating subcontract terms when committed costs exceed budget early
FMI identifies margin gain/fade analysis as a core analytical use case precisely because the difference between catching an overrun in week four versus week twelve can be the difference between a marginal project and a losing one.
Competitive and Strategic Positioning
That margin discipline translates directly into competitive advantage. Firms with real-time financial data operate more decisively across three fronts:
- Estimators price work from actual historical job cost data by cost code and trade — not what was originally budgeted
- Leadership evaluates new opportunities against live capacity and liquidity without waiting on a manual financial snapshot
- Surety underwriters and lenders receive auditable, real-time WIP and cash flow reports on demand, signaling operational maturity
Only 12% of construction organizations consistently incorporate project data into decision-making, according to the Autodesk/FMI research. Firms that do aren't just better informed — they close faster, bid tighter, and carry more credibility with the financial partners who determine bonding capacity and credit lines.
How to Choose the Right Construction BI Platform
ERP Integration Depth
This is the single most important criterion. If the BI platform can't connect directly and reliably to your ERP, you're back to manual exports — the same problem you started with.
Look for:
- Direct API or connector-based integration to your specific ERP (not flat-file imports)
- Automated data cleaning and cost code standardization — different ERP systems use different cost code structures, and reconciling them manually creates the same manual work you're trying to eliminate
- Named support for your actual system: Sage 100/300/Intacct, Viewpoint Vista, Viewpoint Spectrum, Acumatica Construction, Foundation, CMiC, Jonas Construction, Procore
Datateer integrates directly with 12+ major construction ERPs and writes custom integrations for systems not on the standard list. The platform's automated data cleaning engine standardizes cost codes, catches malformed entries, and maps data logic from each system into a unified structure — ensuring 100% data integrity from ERP to dashboard.
Pre-Built Construction-Specific Dashboards
Generic BI tools like Power BI or Tableau require significant construction-specific configuration before they're useful. Building a WIP schedule, a cash flow forecast, and a job cost variance report from scratch can take months and typically requires a dedicated data engineer.
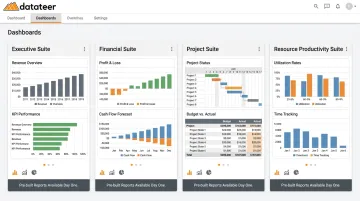
Purpose-built platforms arrive pre-loaded with construction dashboards. Datateer delivers 12 dashboards across four strategic suites on day one:
- Executive — solvency, KPIs, board-level reporting
- Financial — cash management, AR/AP health, cash flow forecasting
- Project — job costing, WIP, change orders, retainage
- Resource Productivity — labor, crew performance, PM scorecards
No configuration required before the data starts flowing.
Data Refresh Frequency and Pricing Model
Datateer's standard configuration is overnight batch sync across all connected ERPs, with more frequent refresh intervals available on request. For most WIP and cash flow decisions, overnight updates are sufficient. What matters is that the data refreshes automatically — not manually.
Pricing models vary widely across BI vendors. Watch for these common cost traps:
| Pricing Model | Risk |
|---|---|
| Per-user licensing | Costs scale rapidly as adoption grows |
| Per-module fees | Dashboard access gets rationed |
| Hidden implementation fees | "Free" setup that costs $50K+ in consulting |
Datateer uses flat annual pricing starting at $10,000 per data source with unlimited users. A firm connecting Sage 300 CRE and Procore would pay approximately $20,000 annually — with no per-seat fees, no dashboard fees, and no hidden implementation costs. Setup is paid upfront; the annual fee starts only when data is flowing.
Building a Data-Driven Culture in Construction
Start With the Highest-Pain Problem
The firms that fail at BI try to implement everything at once. The firms that succeed pick one problem — usually the WIP reporting cycle — prove the value in the first 30 days, then expand.
The right starting framework: define the business question first ("Why does WIP reporting take two weeks?"), then identify the data needed to answer it. This approach builds credibility before asking anyone to change how they work.
Address Resistance Honestly
Construction is a relationship-driven industry with deeply ingrained habits. According to the Autodesk/FMI research, 36% of construction organizations cite lack of organizational support as a barrier to data initiatives, and 36% report teams are simply unsure where to begin.
The most effective change management strategy is relief, not surveillance. When you show a finance team member that their Wednesday night spreadsheet marathon has been replaced by a dashboard that refreshes automatically, the conversation about adoption takes care of itself. Start with the people who bear the heaviest manual reporting burden — their endorsement carries more weight than any executive mandate.
Establish a Source of Truth
Once your team is on board, the next step is getting everyone to agree on one foundational question: which system owns which data? Without that agreement, BI outputs get second-guessed and the spreadsheets come back.
Three governance rules that make an immediate difference:
- The ERP is the financial system of record — not Procore, not a project manager's spreadsheet
- Approved cost codes are mandatory for all job cost entries — inconsistent codes break every downstream report
- One named person owns data quality per system — shared responsibility means no responsibility
These rules don't require a committee or a consultant. They require a decision and a standing policy.
Frequently Asked Questions
What is business intelligence in construction?
Construction BI is the collection, integration, and analysis of project and financial data — from ERP, project management, and field systems — to support faster and more accurate decisions. Unlike project management software, BI focuses on financial reporting, WIP, cash flow, and firm-wide profitability and solvency.
How is construction BI different from standard project management software?
Project management tools like Procore and Buildertrend track tasks, documents, and schedules. BI platforms aggregate financial data across all systems to give leadership a real-time view of profitability, cash position, and WIP — connecting to the ERP rather than replacing it.
What data sources should feed into a construction BI system?
The primary sources are the ERP/accounting system (job costs, AP/AR, payroll), project management software (change orders, subcontracts, schedule), and optionally field data like time tracking and daily reports. The ERP is always the financial system of record, with CSV uploads available to fill gaps for data not covered by automated feeds.
How long does it take to implement a construction BI platform?
Purpose-built platforms with pre-built dashboards and direct ERP connectors — like Datateer — typically have data flowing in 2–4 weeks. Generic tools like Power BI require construction-specific customization that can extend implementation to six months or longer.
What's the difference between business intelligence and data analytics in construction?
BI is descriptive — it tells you what happened and how you're tracking versus budget. Data analytics is predictive — it tells you what's likely to happen based on trends. Most modern construction BI platforms, including Datateer, incorporate both capabilities.
How do construction firms measure ROI from a BI investment?
ROI typically shows up in three areas: hours recovered from manual reporting, margin protected by catching overruns earlier, and stronger bonding and banking relationships from real-time, auditable financials available on demand. Datateer's free Excel Tax Calculator can help quantify the reporting-hours component.