Introduction
Large capital construction projects fail at a rate that should embarrass the industry. According to McKinsey's analysis of over 16,000 projects, only 8.5% met both cost and schedule targets — and a mere 0.5% delivered all promised benefits. A separate McKinsey review of 532 global capital projects found average cost overruns of 79% and schedule delays averaging 52%.
The root cause, more often than not, is a visibility failure — not a planning one.
Cost and schedule visibility means having accurate, current information on budget consumed, costs committed, work completed, and projected cost-at-completion — available at any point in the project lifecycle, not just after month-end close.
The two are inseparable. Every week a project runs late generates real cost consequences: idle equipment, subcontractor remobilization fees, extended general conditions.
This article covers:
- Why visibility breaks down on large capital projects
- How schedule slippage converts directly into cost overruns
- What a robust visibility system actually requires
- How to recognize — and recover — when the system is failing
Key Takeaways
- Large capital projects fail budget and schedule targets at staggering rates — the root cause is almost always a visibility failure, not a planning failure
- Schedule delays and cost overruns are causally linked — you cannot control one without real-time data on the other
- Most visibility failures trace back to data fragmentation, manual reporting, and the lag between field activity and financial systems
- Real control requires one continuously updated source of truth: ERP data, committed costs, field progress, and earned value in a single system
- Monthly accounting reports are too slow to catch overruns; proactive monitoring cadences are the only way to intervene while it still matters
Why Large Capital Projects Are Especially Vulnerable to Visibility Breakdowns
On a smaller project, informal oversight can paper over weak systems. A project manager knows the crew leads, walks the site daily, and has a rough mental model of where money is going. On a $200M capital project, that approach collapses completely.
The Scale Amplifier
A 1% cost variance on a $300M project is $3M of exposure. A 2% schedule slip on an 18-month program is over three weeks of extended general conditions, equipment rentals, and supervision costs. The margin for error is effectively zero, and the tolerance for visibility gaps is no different.
KPMG's 2023 Global Construction Survey found that 37% of respondents missed budget and/or schedule targets due to ineffective risk management, and only 50% of project owners were meeting completion deadlines. On large capital work, that gap between risk identified and risk contained is almost always a visibility problem.
The Data Fragmentation Problem
Large capital projects don't run on one system. A typical project might involve:
- A GC running Viewpoint Vista for project accounting
- A major mechanical subcontractor on Sage 300
- An owner using a separate project management platform
- Field teams logging progress in Procore or spreadsheets
- Procurement tracking purchase orders in a standalone tool
None of these systems talk to each other natively. Producing a consolidated cost view requires someone to manually export data from each system, reconcile cost codes, and consolidate everything into a spreadsheet: a process that is time-consuming, error-prone, and stale the moment it's finished.
The Reporting Lag and Data Burden
A PlanGrid/FMI study of over 1,300 construction professionals found that respondents spent 35% of their time — more than 14 hours per week — on non-optimal activities, including 5.5 hours per week just searching for project data. Those hours aren't spent on analysis — they're spent locating information that should already be accessible.
The practical consequence: by the time a finance team manually assembles a WIP report from multiple systems, the conditions it reflects are already weeks out of date. Datateer's customers report that the traditional manual WIP process takes up to two weeks — with Double L Management noting that their first automated dashboard refresh "replaced two weeks worth of prior work" in a single click.
The Field-Office Disconnect
Field progress — work completed percentages, labor hours burned, crew productivity — often lives in foreman logs, daily reports, or project management apps. The financial systems in the office record invoices, not activity. When these two streams don't connect, accounting records and field reality diverge. A job can look financially healthy in the ERP while burning labor hours at 130% of budget in the field.
How Poor Visibility Turns Schedule Slippage into Cost Overruns
Schedule delays are never just schedule problems. They are cost problems waiting to be invoiced.
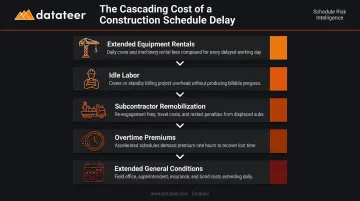
When a construction milestone slips, the cost consequences cascade:
- Extended equipment rentals — cranes, lifts, and specialized machinery on day-rate contracts keep billing
- Idle labor — crews on site but unable to proceed due to predecessor delays
- Subcontractor remobilization — subs who demobilized and need to come back charge for it
- Overtime premiums — attempting to recover lost schedule through accelerated work costs significantly more per hour
- Extended general conditions — every week of project duration adds supervision, site office, utilities, and insurance costs
McKinsey's 2023 analysis illustrates this compounding effect: those same 532 capital projects with 52% average schedule delays also posted 79% average cost overruns. The two don't just correlate — delays mechanically generate costs.
Committed Cost Blind Spots
Most organizations track actual costs (invoices already paid) but not committed costs — purchase orders issued, subcontracts executed, change orders approved but not yet invoiced. On a large capital project, a substantial portion of final cost is contractually locked in well before any invoice arrives. If your cost tracking only reflects what's been billed, you're systematically underestimating your true exposure.
Datateer's Job Costing & Cost-to-Complete module addresses this directly. It tracks four categories simultaneously at job, phase, and cost-code level:
- Actual costs incurred — invoices posted and paid
- Committed costs — active POs and executed subcontracts
- Pending change orders — approved but not yet invoiced
- Projected final cost — rolling cost-at-completion
The separation is visible in real time, not discovered at month-end.
Untracked Change Orders and Scope Drift
Change orders are a particular visibility trap on large capital projects. Individual changes are often modest — $15,000 here, $40,000 there. But when approved changes aren't immediately reflected in updated cost forecasts, the cumulative divergence from baseline budget grows invisibly across dozens of transactions before anyone triggers an alert.
By the time a monthly report surfaces the total, the project may be $2M over committed costs with no record of when each threshold was crossed and no recovery window remaining.
The standard for change order visibility should be tight. Datateer's platform syncs change order data from Procore, Sage, Vista, Spectrum, and Acumatica overnight — meaning a change order approved today appears in the cost-at-completion forecast by the following morning, rather than waiting for the next reporting cycle.
The Building Blocks of Real-Time Cost and Schedule Visibility
Single Source of Truth
Every significant visibility failure on a large capital project traces back to the same root cause: financial data living in multiple systems that don't communicate. No spreadsheet fixes that. The silos have to go.
An effective single source of truth connects:
- ERP actuals — invoiced costs pulled directly from the accounting system
- Committed costs — POs, executed subcontracts, and approved change orders not yet invoiced
- Field progress — percentage complete and earned value data from project management systems
- Change orders — full lifecycle tracking from pending through executed, with aging analytics
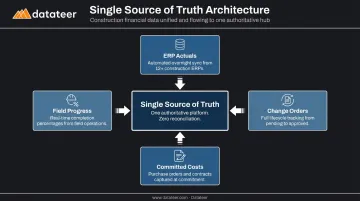
When these data streams feed a common, continuously updated environment, project managers and finance teams stop arguing about whose numbers are right and start making decisions together.
ERP Integration and Automated Data Flow
Direct ERP integration is the foundation that makes everything else possible. When cost data is pulled automatically from the source system, rather than manually exported, reformatted, and reconciled, three things happen:
- The 10–20 day reporting lag disappears
- Human transcription errors are eliminated
- Finance teams move from assembling data to interpreting it
Datateer syncs directly with 12+ major construction ERPs — including Procore, Sage 100/300/Intacct, Viewpoint Vista, Viewpoint Spectrum, Acumatica Construction, Foundation Software, CMiC, Jonas Construction, QuickBooks, and NetSuite — replacing the manual WIP report preparation process with automated overnight data refresh.
Cost code standardization is a prerequisite on any large capital project. When contractors, subcontractors, and change orders each use different cost code structures, aggregating data across the project produces noise, not insight. Datateer's automated data cleaning engine maps cost codes to a unified structure during extraction — reconciliation work that previously took days of manual effort.
Earned Value and Cost-at-Completion Forecasting
Earned Value Management (EVM) connects three dimensions that must be tracked together:
- Budget consumed — what has been spent
- Work completed — what has been physically accomplished (earned value)
- Schedule consumed — how much time has elapsed
The key metrics are straightforward once defined:
| Metric | What It Tells You |
|---|---|
| CPI (Cost Performance Index) | Are you getting $1 of work for every $1 spent? CPI below 1.0 means you're over-spending relative to progress |
| SPI (Schedule Performance Index) | Are you completing work at the planned rate? SPI below 1.0 means you're behind |
| EAC (Estimate at Completion) | Based on current performance, what will this project actually cost? |
Datateer's Job Costing & Cost-to-Complete dashboards calculate CPI, SPI, and EAC in real time across all integrated ERPs — replacing the manual month-end cost-to-complete refresh with continuous automated forecasting.
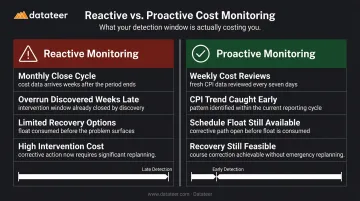
The gap between reactive and proactive visibility comes down to review cadence:
- Reactive: Monthly close reveals an overrun that's been compounding for three weeks. Recovery options are limited and expensive.
- Proactive: Weekly cost reviews catch a CPI trending below 0.9 while there's still schedule float and budget to intervene.
Daily or weekly cost performance reviews — using dashboards that reflect current data, not last month's numbers — convert visibility from a reporting function into a risk management function.
Warning Signs That Your Project's Visibility System Is Failing
These four patterns are diagnostic. If any of them sound familiar, the visibility system has a structural problem — not a people problem.
The reconciliation gap. When the project manager and the finance manager cite different budget figures for the same job, the data is fragmented. This is the most common and most dangerous visibility failure — two people doing their jobs correctly but working from different, disconnected sources of truth.
The report-as-work problem. If the finance team spends the majority of the month building the cost report rather than reviewing and acting on it, the system is inverted. The reporting process has become the deliverable instead of the tool that supports decisions.
A team that finishes the WIP report on day 18 of the month has 10 days to act on it — and that's only if nothing material has changed while the report was being assembled.
The change order lag indicator. Test this: pick a change order approved in the field last week. Does it appear in the current cost-at-completion forecast? If the answer requires investigation, the project is operating with a systematically understated cost exposure. Approved changes should appear in updated forecasts within 24–48 hours — not at the next monthly close.
The data search burden. If project accountants regularly describe their day as "pulling numbers from three different systems before I can answer a basic question," the visibility system is broken at the architectural level. Per the PlanGrid/FMI research, construction professionals already spend 5.5 hours per week searching for project data — hours that could otherwise go toward the analysis that prevents overruns.
How to Get a Project Back on Track When It's Behind Schedule or Over Budget
Step 1: Establish a Defensible Current Baseline
Before any recovery strategy can be designed, the project needs a current, accurate cost-at-completion baseline that separates three distinct buckets:
- Costs already incurred (invoiced and paid)
- Costs committed but not yet invoiced (POs, subcontracts, approved change orders)
- Remaining budget exposure (work not yet contracted or completed)
This baseline must come from actual data, not revised estimates or extrapolations. A triage that starts with "we think we're about X over budget" is not a triage — it's a guess with a number attached. Datateer's Job Costing & Cost-to-Complete and Cost Variance dashboards support this triage directly, separating actual, committed, and projected costs at job, phase, and cost-code level without requiring manual assembly.
Step 2: Diagnose the Type of Overrun
Recovery strategies only work when they address the actual root cause. The three overrun types require fundamentally different responses:
| Overrun Type | Root Cause | Recovery Approach |
|---|---|---|
| Schedule-driven | Delays cascading into extended costs | Re-sequencing, schedule compression, float recovery |
| Scope-driven | Owner-directed changes not fully priced | Contract renegotiation, owner-funded change orders |
| Productivity-driven | Labor or equipment performing below productivity assumptions | Field intervention, crew reassignment, process change |
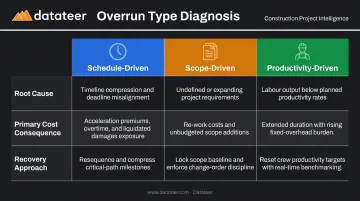
Misdiagnosing the cause leads to recovery plans that don't work. A productivity problem treated as a schedule problem produces acceleration costs without improving productivity. A scope problem treated as a productivity problem burns crew morale without addressing the actual exposure.
McKinsey has documented that schedule optimization techniques can reduce capital project duration by 10–20% while lowering total costs — but only when the schedule problem is correctly identified and addressed structurally, not just managed reactively.
Step 3: Communicate Transparently with a Credible Plan
Once a recovery baseline and root cause diagnosis exist, every stakeholder — owner, GC, key subcontractors — needs to align on the same revised cost-at-completion projection and a documented recovery plan with defined milestones and clear accountability. Late-stage overruns disclosed with a credible plan and clear ownership are consistently received better than ones that surface without warning at final accounting.
The GAO's analysis of U.S. inland waterways construction projects shows what happens instead: where cost and schedule transparency was systematically lacking, the Kentucky Lock Addition ended up at least $229M over original estimates, with delays measured in decades rather than months.
The recovery plan communication isn't just a relationship management exercise. It's how financing draws, subcontractor performance expectations, and owner decisions get realigned to current reality rather than stale projections.
Frequently Asked Questions
What is cost and schedule visibility in construction?
Cost and schedule visibility is the ability to access accurate, current information on budget consumed, committed costs, work completed, and projected final cost at any point during a project — not just after month-end close. The two are inseparable: schedule delays mechanically generate cost consequences, so you cannot manage one without real-time data on the other.
How do you handle a project that is behind schedule or over budget?
Build a current cost-at-completion baseline from actual ERP data — separating costs incurred, costs committed, and remaining exposure. Then diagnose whether the overrun is schedule-driven, scope-driven, or productivity-driven, since each requires a different recovery approach. Communicate the recovery plan with measurable milestones to all stakeholders.
What are the advantages of scheduling in construction management?
A well-maintained schedule creates the framework against which cost performance is measured. It allows teams to forecast cost-at-completion using earned value metrics, identify when labor or equipment is being consumed faster than progress warrants, and catch budget risk before it becomes unrecoverable budget loss.
How do you control cost in construction projects?
Three practices matter most:
- Integrate ERP and field data so cost information reflects current conditions, not three-week-old snapshots
- Track committed costs alongside actual spend so your true exposure is always visible
- Review cost performance weekly — frequent enough to act on variances while recovery is still possible
What causes poor visibility in large capital construction projects?
The most common causes are data fragmentation across multiple contractor systems and ERPs, manual reporting processes that create 10–20 day reporting lags, and the field-office disconnect where progress data from site never flows into the financial systems tracking budget.
How does real-time data improve cost forecasting on capital projects?
Real-time data keeps cost-at-completion forecasts aligned with what is actually happening on the project. This enables earned value analysis using current CPI and SPI, committed cost tracking that includes uninvoiced obligations, and change order visibility that updates forecasts within hours of approval — shifting forecasting from a month-end lookback into an active risk management input.