The question every contractor eventually asks is: Why did this job go over budget—and why didn't I know sooner?
The answer usually isn't one big mistake. It's a pattern of small leaks: labor hours bleeding past estimates, material price spikes absorbed quietly across multiple purchase orders, scope creep handled with verbal approvals, and monthly cost reports that arrive after the damage is already locked in.
This guide covers what job cost variance analysis is, the four types of variances contractors face, a step-by-step investigation process, a real-world foundation overrun example, and how to build variance review into a regular operational discipline—not a quarterly fire drill.
Key Takeaways
- Cost Variance = Budgeted Cost − Actual Cost; negative means over budget, positive means under
- Variance analysis works only at the cost-code level—total project numbers hide where the real problems are
- Every variance is either a quantity problem (used more than estimated) or a rate problem (paid more per unit); each demands a different fix
- Monthly reports arrive too late; weekly variance review is the minimum effective cadence for active jobs
- Data lag is the primary reason most overruns go undetected until they're irreversible
What Is Job Cost Variance Analysis in Construction?
Job cost variance is the mathematical difference between what you budgeted and what you actually spent for a project, phase, or cost code:
Cost Variance = Budgeted Cost − Actual Cost
A positive result is favorable (under budget). A negative result is unfavorable (over budget).
The formula is straightforward. The analysis built around it is what separates contractors who catch problems early from those who discover them at closeout.
Job cost variance analysis is the diagnostic layer that sits on top of job costing. It answers not just whether a project is over budget, but which cost categories are responsible and why.
"We're $67,000 over on the foundation" tells you almost nothing useful. "We're $23,000 over on excavation labor due to unexpected rock and $18,000 over on concrete materials for deeper footings" tells you exactly what to investigate, who to talk to, and what you can negotiate.
How Construction Variance Differs from General Project Variance
Standard variance analysis treats a project as a single entity. Construction variance analysis has to handle:
- Multi-phase projects where early-phase overruns compound into later phases
- Complex cost code structures with dozens of labor, material, equipment, and subcontractor categories
- Simultaneous subcontractor scopes that are billed after the work is done
- Long project durations where a pricing assumption made in Month 1 of bidding may be 18 months stale by execution
The Four Types of Job Cost Variance
| Variance Type | Primary Drivers |
|---|---|
| Labor | Hours exceeding estimate, overtime, wage rates above budget |
| Material | Price increases post-bid, quantity overruns, waste, premium delivery |
| Equipment | Extended rental periods, unexpected breakdowns, idle time |
| Subcontractor | Scope disputes, unprocessed change orders, performance gaps |
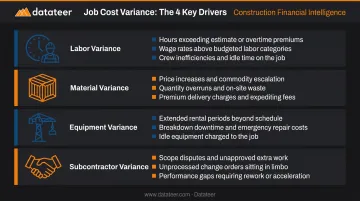
Subcontractor variances are often the hardest to catch early—invoices typically lag behind the work by weeks, which means the financial exposure accumulates invisibly until billing catches up.
Why Job Cost Variance Analysis Is Critical for Contractors
The purpose of variance analysis isn't forensic accounting. It's margin protection—and the window to act is shorter than most finance teams realize.
According to McKinsey's construction productivity research, 70% of large capital projects are delivered over budget, late, or both, with large investment projects averaging 80% cost overruns. The pattern holds at smaller scales too: a KPMG Global Construction Survey found 37% of respondents missed budget and/or schedule targets due to ineffective risk management. With margins averaging around 4%, those misses don't get absorbed—they eliminate profit entirely.
How Small Leaks Become Large Losses
Undetected variances don't stay small. They compound:
- A labor productivity shortfall in Phase 1 sets a flawed baseline for estimating Phase 2 crew hours
- A material price increase absorbed in Month 1 gets repeated across every subsequent purchase order for that material
- A scope change handled verbally by a foreman consumes contingency budget without any formal record—until it's gone
By the time month-end reports surface these issues, the project has moved forward. The concrete is poured. The subcontractor invoice is approved. The corrective options have narrowed dramatically.
The Strategic Case for Finance Teams
Regular variance review changes what construction finance looks like in practice. Instead of producing backward-looking reports nobody reads until it's too late, finance teams that review variance weekly can:
- Alert project managers to problems while recovery is still possible
- Feed real cost data back into future estimates
- Build cost awareness across field and office teams who don't naturally think in budget terms
- Identify subcontractor performance patterns before they repeat across future jobs
Weekly variance review is what moves finance from a reporting function into a role that shapes project outcomes before they're locked in.
How to Perform Job Cost Variance Analysis: Step by Step
Each step below builds on the previous one. Skipping the data validation step or the field investigation doesn't save time—it invalidates the analysis.
Step 1: Gather and Validate Cost Data
Collect everything before running a single comparison:
- Original budget broken down by cost code
- All purchase orders and subcontracts
- Labor timesheets coded by cost code and phase
- Material invoices and delivery tickets
- Equipment rental agreements
- Approved and pending change orders
Reconcile bid estimate cost codes against job cost report codes before proceeding. If a project was bid under one code structure and reported under another, every variance figure becomes misleading. Miscoded labor — charged to the wrong phase — is one of the most common sources of false variances. Once a finance team spends hours chasing a phantom overrun, trust in the entire reporting process erodes.
Step 2: Calculate Variance at the Cost-Code Level
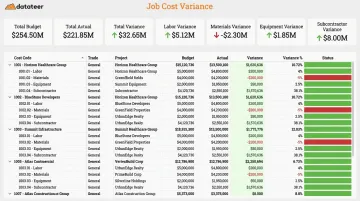
Total project variance is almost useless for decision-making. A $47,000 overrun means nothing until it's decomposed:
- $28,000 labor variance — concrete work
- $15,000 material variance — rebar price increase
- $4,000 equipment variance — crane rental extension
Calculate each variance as both a dollar amount and a percentage of budget. Percentage variances surface proportional problems in smaller cost codes that dollar figures alone miss. A $4,000 overrun on a $12,000 line item (33%) is far more concerning than $4,000 on a $200,000 subcontract (2%).
Step 3: Separate Quantity Variance from Rate Variance
Two underlying causes drive most variances — and they point in completely different directions:
- Quantity variance = you used more of something than estimated (labor hours, material volume, rental days)
- Rate variance = you paid more per unit than budgeted (wage rates, material prices, rental rates)
These require completely different responses:
| Variance Type | Points To | Response |
|---|---|---|
| Quantity variance | Productivity, scope, or design issues | Field investigation, scope review |
| Rate variance | Procurement, market conditions, or bid assumptions | Renegotiate, escalation clause, future bid adjustment |
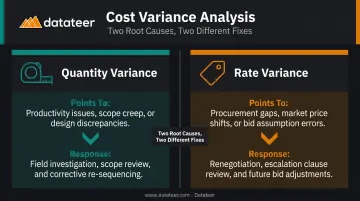
A labor overrun caused by lower-than-estimated crew productivity calls for a field conversation about methods and supervision. One caused by wage rates 15% above bid calls for a procurement and estimating review. Treating one as the other wastes everyone's time.
Once you know what type of variance you're dealing with, you need to find out why it happened. That answer rarely lives in the cost report.
Step 4: Investigate Root Causes in the Field
Field superintendents and foremen know what actually happened on the job — they just rarely get asked.
Questions worth asking:
- What caused the extra hours? Was it design changes, rework, or coordination failures?
- Were there unforeseen site conditions that slowed production?
- Did the work sequence change mid-phase?
- Were subcontractors waiting on predecessor trades?
Keep these conversations fact-finding, not blame-assigning. Two structured tools help:
- 5 Whys — ask "why" repeatedly until the actual root cause surfaces (not just the symptom)
- Fishbone Diagram — organize causes by category: People, Methods, Materials, Equipment, Environment, Management
Step 5: Document Findings and Execute a Recovery Plan
A useful variance report contains six things:
- A factual summary of what happened and when
- The root cause, confirmed through field investigation
- Dollar impact broken down by cost code
- Who owns it — owner-directed change, estimating error, field execution, or market condition
- Specific recovery actions for remaining work
- Lessons learned for future estimates
This document serves two purposes simultaneously: it guides internal corrective action and supports change order negotiations when the root cause is owner-directed.
Corrective actions vary by type:
- Labor overrun: Reassess crew productivity targets, add supervision, adjust work methods
- Material variance: Negotiate volume pricing, consider approved substitutions, tighten procurement timing
- Scope creep: Enforce a written change order policy — brief all field staff that verbal authorizations aren't valid
One step many teams skip: revise the internal budget to reflect current reality. Managing remaining work against an original budget that's already been exceeded sets the team up to miss again.
Job Cost Variance Analysis: A Real-World Example
A general contractor bids a $2.8M commercial building with a $180,000 foundation budget. Four weeks into excavation, costs have reached $247,000—a $67,000 overrun. The PM pulls labor timesheets, subcontractor invoices, equipment rental logs, and the original geotechnical report.
Cost-code breakdown of the $67,000 overrun:
| Cost Code | Variance | Cause |
|---|---|---|
| Excavation labor | +$23,000 | Rock blasting — additional work |
| Concrete materials | +$18,000 | Deeper footings — more volume + premium delivery |
| Structural engineering | +$12,000 | Redesign for deeper foundation |
| Dewatering | +$14,000 | Groundwater management not in original scope |
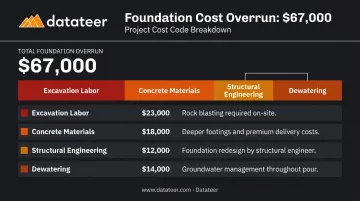
The rock blasting is a pure quantity variance—more work than estimated, at the same unit rates. The deeper footing concrete is both: more volume and a premium delivery surcharge added at the last minute. Two root causes, one cost code.
The PM interviews the site superintendent and finds that the geotechnical report included only two soil borings, which missed a rock shelf covering 40% of the building footprint. That's a differing site condition—not an estimating error and not a field performance failure.
The contractor prepares a formal variance report, submits a $62,000 change order supported by the analysis, and negotiates a partial settlement. The residual absorbed internally generates three recorded lessons for future projects:
- Require minimum boring density based on site variability
- Add explicit subsurface risk contingency when geotechnical data is limited
- Document all baseline assumptions in the bid file before the project starts
Weekly variance reviews would have changed the outcome here. The rock shelf discovery in Week 1 would have triggered the change order process two weeks earlier—before dewatering costs accumulated and before the engineering redesign was authorized without written approval.
How Datateer Helps Construction Teams Catch Variances Earlier
The biggest structural barrier to timely variance analysis isn't effort—it's data lag. When cost data lives in spreadsheets built manually from ERP exports, finance teams routinely face a 10–20 day gap between when costs are incurred and when a variance report is ready. By then, the project has moved forward and the corrective window has narrowed.
Datateer eliminates that lag by integrating directly with 12+ construction ERPs, including Procore, Sage, Viewpoint Vista, Acumatica, Foundation, CMiC, and Jonas, and syncing job cost data automatically on an overnight cycle, with more frequent refreshes available.
What this looks like in practice for construction finance teams:
- View current-period budget vs. actual by cost code without exporting a single CSV
- Drill from total project variance down to labor by trade, materials by category, equipment, and subcontractor—in the same dashboard
- Identify jobs showing negative variance before month-end, not after
- Bring current data to project review meetings rather than numbers that are two weeks stale
Datateer's Cost Variance, Job Costing & Cost-to-Complete, and Margin Protection dashboards each provide variance visibility at the job, phase, cost code, and resource type levels.
The Material Price Escalation module goes a step further: it compares actual purchased unit prices against both original bid estimates and external indices (PPI, ENR Material Cost Index) to surface rate variances driven by market conditions before they accumulate across multiple purchase orders.
One client from Double L Management noted that "the very first time we accessed our data through a Datateer analytics dashboard, that one click replaced two weeks worth of prior work."
That kind of time savings translates directly into earlier variance decisions. The platform is built for construction firms from $10M to over $1B in annual revenue, with:
- Flat annual pricing starting at $10,000/year per data source
- Unlimited users at no additional cost
- 2–4 week implementation
- Annual fees that don't start until data is actively flowing
Conclusion
Job cost variance analysis is not a report you run at project closeout. It's a weekly operational discipline: compare budgeted to actual at the cost-code level, separate quantity problems from rate problems, investigate root causes in the field, and use what you find to both recover on current work and sharpen future estimates.
Contractors who build this discipline—and who connect their field data to financial systems without the lag that turns monthly reports into history lessons—don't just survive tight-margin environments. They build estimating accuracy over time, stop margin fade before it compounds, and earn the financial credibility to pursue larger, more complex work. That starts with data that's current enough to act on, not just report on.
Frequently Asked Questions
How do you calculate job cost variance?
Use the formula: Cost Variance = Budgeted Cost − Actual Cost. A negative result means over budget; positive means under. Run this calculation at the cost-code level—labor, materials, equipment, and subcontractors separately—not just at the total project level, or the results won't tell you enough to act on.
What is the best job costing software for construction?
Two categories matter here. Construction ERPs (Sage, Viewpoint Vista, Procore, Acumatica) capture and code job costs at the source. Analytics platforms like Datateer connect to those ERPs to automate variance reporting, deliver real-time dashboards, and close the lag between cost incurrence and financial visibility.
What is a favorable vs. unfavorable job cost variance?
A favorable variance means actual costs came in below budget (strong execution or better-than-expected pricing). An unfavorable variance means costs exceeded budget. Identifying the root cause matters: contractor performance, estimating error, owner-directed change, and unforeseeable conditions each require a different response.
How often should contractors review job cost variance?
Weekly is the effective minimum for active projects—monthly reports arrive too late for meaningful corrective action. CFMA guidance supports daily or weekly monitoring of key risk indicators including margin fade. Automated dashboards make weekly review practical by eliminating the manual data prep that makes frequent analysis unsustainable in spreadsheets.
What are the most common causes of negative job cost variance?
Four causes account for most overruns:
- Scope creep: work added without formal change orders
- Poor initial estimates: incomplete drawings, outdated pricing, or thin contingency
- Unexpected site conditions: subsurface issues, utility conflicts, or groundwater
- Labor productivity shortfalls: actual hours exceeding estimated hours due to design changes, coordination failures, or rework
Can variance analysis help with change order negotiations?
Yes—this is one of its most practical uses. A well-documented variance report that establishes root cause (differing site condition, owner-directed change, design revision) provides the evidentiary foundation for a change order claim. Without that documentation, the cost falls on the contractor.