
Introduction
A construction firm can be fully booked — crews deployed, contracts signed, backlog healthy — and still finish the year barely breaking even. This isn't a hypothetical. It's a pattern that plays out across the industry every year, and it's getting harder to avoid in 2024.
The problem isn't revenue. It's margin. Specifically, it's the gap between what a project was estimated to earn and what it actually delivers at close.
Construction consistently operates on thinner margins than most other industries. According to CFMA's 2024 Construction Financial Benchmarker, the average net income before taxes across all contractor respondents was 6.3% of revenue in fiscal 2023 — leaving almost no buffer for cost overruns. In 2024, compounding pressures from labor cost escalation, material price volatility, and fixed-price contract exposure have made protecting that margin even harder.
This article covers:
- What margin benchmarks actually look like by sector
- How to calculate gross and net margins correctly
- What's eroding margins right now
- What construction finance teams can do about it
Key Takeaways
- CFMA data shows all-contractor average net margins of 6.3%; best-in-class firms hit 11.9% — know which benchmark you're chasing
- Gross margin and net margin tell different stories: a healthy gross can mask a thin net when overhead isn't allocated to jobs correctly
- Margin fade — the gap between estimated and actual profit — is largely preventable with real-time visibility
- Labor cost escalation and material price volatility are compressing margins across all sectors in 2024
- Real-time WIP reporting separates firms that catch margin erosion early from those that find out at month-end close
Gross vs. Net Profit Margin: Why the Distinction Matters in Construction
Gross Profit Margin
Gross profit margin measures whether your pricing covers the cost of doing the work — nothing more, nothing less.
Formula: (Revenue − Direct Costs) ÷ Revenue × 100
Direct costs include field labor (with burden), materials, subcontractors, equipment rental, and permits. Everything that goes into delivering a specific project.
Example: A $2M contract with $1.5M in direct costs produces a 25% gross margin. That looks solid. But it doesn't tell you what the firm actually keeps.
Net Profit Margin
Net profit margin is what remains after overhead — office rent, insurance, administrative salaries, software, accounting, legal — is subtracted from gross profit.
Formula: Net Income ÷ Revenue × 100
Continuing the example: if that $2M project carries $400,000 in allocated overhead, net income drops to $100,000 — a 5% net margin. The 25% gross margin looked healthy. The 5% net margin reveals how little room actually exists for anything to go wrong.
Why Construction Firms Misread Their Own Profitability
Most construction firms track gross margin at the job level. Far fewer properly allocate overhead back to individual projects — meaning every WIP report showing a healthy gross margin may be concealing a dangerously thin net margin underneath.
That gap explains how firms end up winning work, delivering it competently, and still underperforming financially year after year. Two tracking habits separate firms that catch this early from those that don't:
- Monitor gross margin and net margin at the job level — not just company-wide
- Allocate overhead back to individual projects during the WIP review cycle, not only at year-end
Knowing both numbers per job isn't optional for firms serious about profitability.
Platforms like Datateer automate this by connecting WIP reporting and overhead absorption tracking in one place — so under-allocated overhead surfaces during a project, when there's still time to act on it.
Construction Profit Margin Benchmarks in 2024
Margin benchmarks vary significantly by sector, project type, and firm size. Comparing against the right peer group matters more than comparing against an industry-wide average.
The table below draws from CFMA's 2024 Construction Financial Benchmarker and NAHB's 2025 study on builder financial performance.
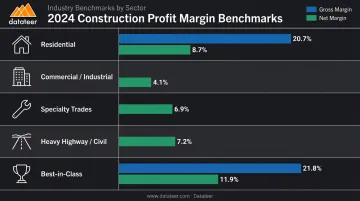
| Sector | Typical Gross Margin | Typical Net Margin | Key Driver |
|---|---|---|---|
| Residential (single-family) | ~20.7% | ~8.7% | Strong demand cycle, land/lot economics |
| Commercial / Industrial | Not separately published | ~4.1% | Competitive bidding, project complexity |
| Specialty Trades | Not separately published | ~6.9% | Licensing barriers, service work premiums |
| Heavy Highway / Civil | Not separately published | ~7.2% | Public funding volumes, equipment intensity |
| Best-in-Class (all sectors) | ~21.8% | ~11.9% | Disciplined bidding, overhead control |
Residential Construction
NAHB data shows single-family builders averaged 20.7% gross margin and 8.7% net margin in 2023 — the strongest net margin performance in more than three decades, except for 1991's 10%. This reflects favorable demand conditions through most of 2023. In 2024, high mortgage rates, rate buydowns, and price concessions have introduced renewed pressure on residential margins.
Commercial Construction
CFMA's Industrial and Nonresidential category — the closest available proxy for commercial GCs — reported 4.1% net income before taxes. On a $10M project, that's $410,000 in net profit — real money, but with virtually no cushion for cost overruns. A single underpriced subcontractor package or labor estimate that misses hours by 10% can eliminate the entire net margin on a commercial job.
Specialty Trades
Specialty contractors (electrical, plumbing, HVAC, mechanical) reported 6.9% net margins in CFMA's 2024 data — outperforming commercial GCs by nearly 3 percentage points. Three factors drive that premium:
- Licensing requirements limit competition in ways that open-bid commercial work does not
- Technical expertise commands higher rates across electrical, mechanical, and HVAC scopes
- Service and maintenance work carries structurally higher margins than new construction
How to Calculate Construction Profit Margins
Gross Profit Margin
Formula: (Revenue − Direct Costs) ÷ Revenue × 100
Worked example:
- Contract value: $3,000,000
- Direct costs: field labor $750,000 + materials $900,000 + subcontractors $600,000 + equipment $150,000 = $2,400,000
- Gross profit: $600,000
- Gross margin: 20%
Net Profit Margin
Formula: Net Income ÷ Revenue × 100
Continuing the same example, applying an overhead allocation to that project:
- Annual overhead (office salaries, rent, insurance, software): $1,200,000
- Annual direct costs across all projects: $8,000,000
- Overhead burden rate: 15% ($1,200,000 ÷ $8,000,000)
- Overhead allocated to this $3M project: $2,400,000 × 15% = $360,000
- Net income: $600,000 − $360,000 = $240,000
- Net margin: 8%
The gross margin looked strong at 20%. The net margin — what the firm actually keeps — is 8%. That 12-point spread between gross and net is overhead. Firms that don't track it per job won't know where it's going.
Markup vs. Margin: A Critical Distinction
This is where real money gets lost in estimating. Markup and margin are not the same calculation, and confusing them systematically underprices every bid.
- Markup is calculated as a percentage of cost
- Margin is calculated as a percentage of revenue
A 25% markup on $2,400,000 in costs produces a bid price of $3,000,000 — which is a 20% gross margin, not 25%.
| Target Gross Margin | Required Markup on Cost |
|---|---|
| 20% | 25.0% |
| 25% | 33.3% |
| 30% | 42.9% |
| 35% | 53.8% |
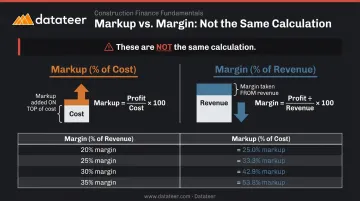
When estimators apply a markup multiplier as though it equals a margin target, every bid goes out underpriced. On a $5M project, the gap between a 25% markup and a 25% margin target is $100,000 in missing revenue — not a rounding error.
Why Construction Margins Erode in 2024
Margin Fade: The Gap Between Estimated and Actual Profit
Margin fade is what happens between bid day and project close — and it has identifiable causes that compound when they go undetected. The pattern Datateer observes across its construction clients is consistent:
- Labor overruns accumulate between payroll cycles
- Material costs drift above bid-time assumptions
- Change orders stall in the approval chain
- Overhead is under-absorbed
Together, these forces erase net margin before anyone realizes it's happening.
KPMG's 2023 Global Construction Survey found that 45% of respondents experienced schedule delay or cost impacts exceeding 20% — a proxy for how common cost divergence is across the industry, even if it understates the frequency of smaller-scale fade on typical commercial jobs. a proxy for how common cost divergence is across the industry, even if it understates the frequency of smaller-scale fade on typical commercial jobs. Each of the causes below contributes to that divergence in a distinct and measurable way.
Labor Cost Escalation
According to the AGC's 2024 Construction Hiring and Business Outlook, 63% of construction firms increased base pay more than they did in 2022, and 58% named direct labor costs as a major concern. On fixed-price contracts, wage increases that weren't priced into the original bid come entirely out of margin. Underestimated labor hours compound this — a job that runs 10% over on hours can wipe out the entire net margin on a thin-margin commercial project.

Material Price Volatility and Tariff Exposure
The 2024 material picture is mixed rather than uniformly negative: AGC/BLS PPI data shows steel mill products fell 8.8% while lumber and plywood dropped 1.7% — but aluminum rose 0.9%, and tariff exposure introduced new uncertainty. NAHB reported that U.S. Commerce raised Canadian softwood lumber duties from 8.05% to 14.54% in 2024. For contractors on lump-sum contracts priced before mobilization, any material cost increase — regardless of direction — is absorbed entirely by the contractor if no escalation clause exists.
Scope Creep and Unpriced Change Orders
Every undocumented scope change that crews absorb without an approved change order transfers profit directly from the contractor to the owner. The compounding effect is the real danger: a dozen small changes, each individually below the threshold of formal attention, can collectively eliminate a project's entire net margin. Datateer's Change Order Impact, Aging & Win-Rate Analytics module tracks change orders across the full lifecycle — pending, approved, denied, executed — quantifying the margin impact of stalled or unapproved COs at the cost-code level before the job closes.
The Data Lag Problem
In firms relying on manual WIP processes, project cost reports are produced 10–20 days after the period they cover. By the time a finance leader sees that a project is running over on labor budget, the crew has already logged three more weeks of time.
CFMA guidance calls for monitoring margin fade, job borrow, and cash KPIs on a daily or weekly basis — a standard that monthly close cycles structurally prevent. This reporting lag is one of the most underappreciated drivers of margin erosion in the industry, because it doesn't show up as a line item. It shows up as a pattern of margin surprises that never get caught in time.
Strategies to Protect Your Construction Profit Margins
Know Your True Overhead Burden Rate — and Apply It to Every Bid
One common approach is to calculate overhead burden rate as total annual overhead divided by total annual direct costs, then apply that rate consistently to every project during bidding. An outdated or estimated rate erodes every job that goes out the door — if your overhead has grown but your burden rate hasn't been updated, you're winning work at prices that don't fully recover indirect costs.
Datateer's Overhead & Burden Rate Analytics module calculates actual fully-burdened labor rates by craft, department, and division, then compares budgeted burden rates to actuals. When actual rates have shifted, the module surfaces that divergence before it gets baked into new bids at the wrong number.
Build Contract Protections for Cost Volatility
Contractors who locked in lump-sum prices before 2024 material and labor movements bore 100% of those cost increases. Contract protections that transfer some of that risk include:
- Material escalation clauses tied to published indices (PPI, ENR Material Cost Index)
- Indexed pricing mechanisms for long-duration contracts
- Cost-of-work or GMP structures for projects with extended procurement timelines
ConsensusDocs specifically recommends objective index-based price escalation clauses as a standard risk management tool for firm-fixed contracts.
Practice Disciplined Job Selection
Not all revenue is good revenue. A $3M project at 4% net margin is less valuable than a $1M project at 14% net margin — and far less if the $3M job runs over. Finance leaders should track margin performance by project type, client, and sector, then pursue work that consistently hits target margins.
Underbidding to stay busy is a margin problem disguised as a revenue solution. The pipeline looks healthy; the bank account doesn't.
Replace Lagged Reporting with Real-Time Financial Visibility
The firms protecting margins in 2024 are those whose finance teams can see live cost-versus-budget comparisons on active projects — not waiting for month-end close to discover what already went wrong.
Datateer connects directly to 12+ construction ERPs (including Procore, Sage 100/300/Intacct, Viewpoint Vista, Acumatica, Foundation Software, CMiC, and Jonas Construction) and delivers:
- Real-time WIP reports, margin dashboards, and PM scorecards that refresh continuously
- A 2-minute dashboard refresh from ERP-sourced data, replacing the 10–20 day lag common in manual spreadsheet workflows
- Live cost-versus-budget visibility that flags labor slippage, material escalation, and stalled change orders while there's still time to act
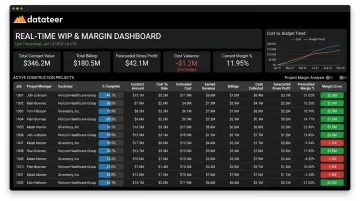
As Double L Management described their first experience with the platform: "That one click replaced two weeks worth of prior work." Implementation typically takes 2–4 weeks, with live dashboards running before annual fees begin.
For construction finance teams, that speed translates directly into strategic impact: instead of explaining what already went wrong, CFMs can catch problems mid-project and redirect outcomes before the job closes.
Frequently Asked Questions
What is a good profit margin for a construction company in 2024?
CFMA's 2024 data shows the all-contractor average at 6.3% net margin, with best-in-class firms reaching 11.9%. For commercial GCs, 4–6% is typical; specialty trades often target 7–10%. Benchmark against your specific trade and firm size — sector, overhead structure, and project mix all shift what "good" actually means.
Is a 22% profit margin good?
The answer depends entirely on whether that figure is gross or net. A 22% net margin is exceptional in construction and would represent strong performance in almost any industry. A 22% gross margin is closer to the residential builder average and unremarkable for specialty trades. Ask which figure is being cited before drawing any conclusion.
Is 20% margin the same as 25% markup?
No. A 25% markup on direct costs produces a 20% gross margin, not 25%. Markup is a percentage of cost; margin is a percentage of revenue. They use different denominators and are not interchangeable. Confusing them in estimating means every bid is systematically underpriced.
What is the difference between gross and net profit margin in construction?
Gross margin is revenue minus direct project costs (labor, materials, subs, equipment). Net margin subtracts overhead and G&A as well. A job can show a healthy gross margin at the project level while breaking even — or losing money — once the firm's indirect costs are properly allocated back to that job.
What causes margin fade in construction?
The most common causes are underestimated labor hours, unpriced scope changes absorbed without approved change orders, material costs rising above bid-time assumptions, and the absence of real-time cost tracking. Without live visibility, these issues compound undetected across payroll cycles until the margin is already gone.
How does delayed financial reporting affect construction profit margins?
When WIP and project cost data is 10–20 days stale, finance teams are doing forensic accounting rather than managing margins in real time. By the time overruns become visible in a month-end report, the project has already moved on and course correction is no longer possible. Reporting speed is a direct driver of profitability: it is not a back-office convenience.