Introduction
US construction productivity has essentially gone nowhere for half a century. While manufacturing, agriculture, and services have each roughly doubled or tripled output per worker since 1970, construction has moved in the opposite direction.
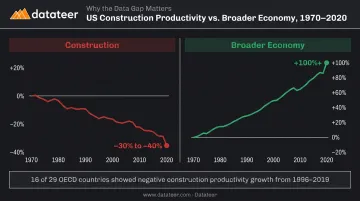
According to the Richmond Fed, US construction labor productivity fell more than 30% from 1970 to 2020 — a period when economy-wide productivity more than doubled. Goldman Sachs puts the trend loss at 0.6% per year since 1965, compared to 1.6% annual growth across the broader economy.
This isn't a recent blip or a pandemic artifact. Researchers flagged construction's underperformance as far back as the 1970s. The pattern is structural and persistent — with real consequences for GDP growth, housing affordability, and infrastructure budgets that compound every year it goes unaddressed.
For construction CFOs, financial controllers, and firm leadership, the macro numbers are only half the picture. This report breaks down what the productivity data actually shows, why the stagnation persists, and how it translates into decisions about projects, margins, and resource allocation on the ground.
Key Takeaways
- US construction labor productivity fell more than 30% from 1970–2020, while economy-wide productivity more than doubled
- That decline is real, not a measurement artifact — physical output measures like housing units per worker confirm it
- Root causes include land-use regulation, limited tech adoption, and fragmentation that keeps firms too small to invest in productivity
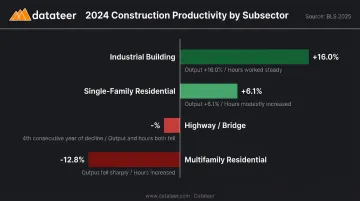
- Subsector results diverge sharply: industrial building rose 16% in 2024; highway/bridge declined for the fourth straight year
- Firms can't fix structural barriers alone, but they can control how quickly they detect labor slippage and margin fade on active projects
The State of US Construction Productivity: Decades of Stagnation
How Bad Is the Decline?
The Goolsbee-Syverson NBER study found construction value added per worker was approximately 40% lower in 2020 than in 1970 — a finding that holds even after controlling for measurement challenges. Richmond Fed and Goldman Sachs corroborate this with the 30%+ decline figure across the same period.
This isn't uniquely American — though the US ranks among the worst cases. Goolsbee and Syverson found that 16 of 29 OECD countries had negative average labor productivity growth in construction from 1996–2019. The problem is global, but the US trajectory is among the steepest declines in the G10.
The Economic Cost
The macro consequences extend well beyond any single firm's job cost report. Research from D'Amico, Glaeser, Gyourko, Kerr, and Ponzetto (NBER, 2024) estimates construction's productivity stagnation explains more than one-fourth of the 2.8 percentage point decline in annual US GDP growth since World War II — equivalent to roughly $1 trillion in lost output every five years.
The downstream effects show up in housing affordability, infrastructure project costs, and public budgets.
What "Productivity" Means Here
In this context, productivity means output divided by input:
- Output: construction value added, total spending, units built, or square footage completed
- Input: labor hours worked or full-time equivalent employees
When productivity falls, it takes more workers and more hours to produce the same amount of construction. That cost gets passed somewhere — to owners, to public budgets, or to firm margins when it can't be passed on.
How to Measure Construction Productivity
Productivity measurement in construction is difficult — and that difficulty is part of why the debate about the scale of the decline has persisted for decades. There are four useful levels of analysis:
| Level | What It Measures | Best Used For |
|---|---|---|
| Sector-wide | Value added or spending per labor hour (BEA/BLS) | Long-run trend comparisons |
| Subsector | Units or sq ft per employee by construction type | Industry benchmarking |
| Project-level | Labor hours per square foot or cost code | Operational performance |
| Task-level | Installation rates by trade | Crew and schedule management |
The Deflator Problem
When measuring output in dollars, you have to adjust for inflation. Using input-based deflators (which track changes in material and labor costs) can mask actual productivity changes. Output-based deflators, which track finished building prices, are preferable but harder to construct accurately.
The Goolsbee-Syverson study found the construction output price deflator grew 5.47% annually after 1970, versus 3.37% for the overall GDP deflator. That gap matters for how large the productivity decline appears. However, Federal Reserve research found deflator mismeasurement can explain at most 0.75 percentage points per year of the productivity gap — significant, but not enough to erase the stagnation. Deflators are only one layer of the measurement challenge.
The Output Mix Problem
Construction isn't a single product. The sector builds single-family homes, highways, data centers, and hospitals — each with very different labor intensity. If the mix shifts toward more complex projects over time, measured sector productivity falls even if nothing changes at the individual project level.
Single-family residential illustrates this clearly: measured in units per worker, productivity declined roughly 1% per year. Measured in square feet per worker, it rose about 0.5% per year since 1990, because average home sizes grew from 1,660 sq ft in 1973 to over 2,400 sq ft by the 2010s.
Firm-Level Metrics That Actually Matter
Academic research focuses on macro metrics. Construction finance teams track productivity through:
- Labor cost per unit installed by cost code
- Cost Performance Index (CPI) and Schedule Performance Index (SPI) via earned value
- Budget-to-actual labor variance by phase and trade
- Percent complete vs. percent billed on WIP schedules
- Crew productivity ratios by trade
These granular, project-level signals give finance teams the most actionable data available. They won't reverse sector-wide stagnation — but tracked consistently, they tell you exactly where your firm is gaining or losing ground on active work, while there's still time to act.
The Root Causes of Construction's Productivity Problem
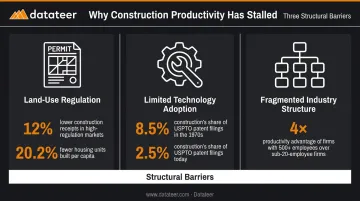
Three structural factors explain most of the stagnation. They interact, but each has independent research support.
Land-Use Regulation
D'Amico et al. (NBER, 2024) provide the most rigorous causal evidence. A one-standard-deviation increase in the Wharton Residential Land Use Regulation Index is associated with:
- 12% lower total receipts per establishment
- One-third lower large-firm employment share in building construction
- 20.2% fewer housing units built per capita
Permitting delays and zoning restrictions push developers toward smaller projects. Smaller projects keep firms small — and small firms can't afford the capital investment, training infrastructure, or process R&D needed to improve productivity.
Federal Reserve research corroborated this, finding permit approval times are the most robustly correlated regulatory variable with productivity decline.
Limited Technological Innovation
Manufacturing absorbed automation, robotics, and computing across multiple waves since the 1950s. Construction's core equipment, by contrast, has changed relatively little — cranes, bulldozers, and concrete mixers do essentially the same jobs they did 60 years ago.
Patent activity tells the story:
- Construction accounted for 2.5% of USPTO patents in 2020, down from a peak of 8.5% in 1909
- Manufacturing patent activity continued growing after 1970; construction's stagnated
- Offsite construction — which could reduce on-site labor intensity — accounts for just 3% of single-family completions in the US, per NAHB's 2024 analysis of Census data
Fragmented Industry Structure
Firm size matters enormously for productivity. D'Amico et al. found that firms with 500+ employees produce about four times as many residential units per employee as firms with fewer than 20 employees. About two-fifths of employment in new single-family housing construction sits in firms with fewer than five employees.
If US residential construction firms matched the size distribution of manufacturing firms, they would be an estimated 60% more productive — assuming half the observed size-productivity relationship is causal. That's a counterfactual, not a forecast, but it illustrates the scale of the fragmentation penalty.
Subsector Breakdown: Where Construction Productivity Is Rising and Falling
The BLS tracks four construction subsectors, and their 2024 results look nothing alike. Treating "construction" as a single operating benchmark misleads any firm trying to understand its own performance.
| Subsector | 2024 Productivity Change | Key Details |
|---|---|---|
| Single-family residential | +6.1% | Output +5.9%, hours -0.1% |
| Multifamily residential | -12.8% | Output -12.2%, hours +0.7% |
| Industrial building | +16.0% | Output +16.7%, hours +0.7% |
| Highway/bridge | Declined (4th consecutive year) | Output -3.7%, hours +2.1% |
Source: BLS Construction Labor Productivity, 2025
Industrial building construction has been the standout performer, fueled by data center and manufacturing facility construction demand. Highway and bridge construction tells the opposite story: four consecutive years of decline from 2021 through 2024, adding hours while output contracted.
Single-family residential shows a familiar split: the units-per-worker measure shows long-run decline, but square-footage-per-worker has risen as homes have gotten larger. Average floor area for completed single-family homes grew from 1,660 sq ft in 1973 to 2,411 sq ft in 2023. Which measure looks better depends on what you're building and what you're benchmarking against.
The practical takeaway for finance teams: benchmark labor productivity by project category, not firm-wide. Blended averages obscure what's actually happening at the project level:
- Industrial and commercial work operates in a fundamentally different productivity environment than multifamily or highway
- A firm mixing subsectors can show a "flat" blended average while one segment surges and another collapses
- Project-level benchmarking is the only way to catch divergence before it hits the bottom line
What Firm-Level Productivity Tracking Looks Like in Practice
The Gap Between Knowing and Acting
Sector-wide stagnation is a structural problem no single firm can solve. What firms can control is the speed at which they detect problems on active projects.
FMI's 2025 Project Management Study found only 2.5% of firms say projects consistently finish on time and on budget. McKinsey data shows large construction projects typically run 20% over schedule and up to 80% over budget. The common thread in overruns isn't just that problems occurred — it's that they weren't visible until they were unfixable.
A productivity problem caught in week three looks very different from the same problem discovered at project close. The first is a correctable variance. The second is margin loss that's already locked in.
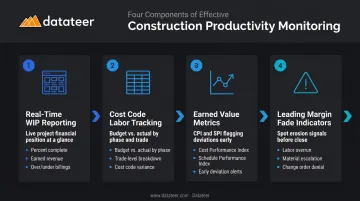
What Meaningful Monitoring Requires
Effective firm-level productivity tracking needs four things working together:
- Real-time WIP reporting : percent complete, earned revenue, over/under-billings, and projected margin per job — updated frequently enough to act on
- Cost code-level labor tracking : budget vs. actual by phase, trade, and resource type
- Earned value metrics : CPI and SPI at the project level, flagging schedule and cost deviations before the final job cost report
- Leading indicators of margin fade : labor overrun, material escalation, subcontractor cost increases, and change order denial — tracked in-progress, not after the fact
The problem most firms face is that manually assembled WIP reports carry a 10–20 day lag from when costs are incurred to when finance teams see them. That's enough time for a labor variance to compound from manageable to severe. By the time the monthly WIP report is assembled, finance teams are in forensic mode — documenting what went wrong rather than intervening while there's still time.
From Forensic Accounting to Proactive Management
Construction-specific analytics platforms close this gap by pulling directly from ERPs — Procore, Sage, Viewpoint Vista, Foundation, Acumatica, and others — to deliver metrics that refresh overnight rather than monthly. Datateer's platform, for example, includes three dashboards that address the most common sources of margin fade:
- Labor & Materials Productivity: surfaces budget blowouts by crew and cost code
- Job Costing & Cost-to-Complete: tracks actual costs, committed costs, pending change orders, and projected final cost at the job, phase, and cost code level — including CPI and SPI
- Margin Protection: flags negative variance drivers (labor overrun, material escalation, change order denial) before they appear in quarterly results
One Double L Management analyst described the shift this way: "The very first time we accessed our data through a Datateer analytics dashboard, that one click replaced two weeks worth of prior work."
That shift — from assembling data to acting on it — starts with tracking the right leading indicators:
- Labor cost per unit installed by cost code and trade
- Cost-to-complete vs. original budget at job and phase level
- Percent complete vs. percent billed — misalignment here signals both billing risk and potential labor slippage
- CPI trending — a CPI below 1.0 and declining is a clear signal before job cost reports confirm the damage
Datateer's implementation runs 2–4 weeks, with all 12 dashboards — WIP, labor productivity, cost variance, and more — activating simultaneously once data begins flowing.
Frequently Asked Questions
How do you measure productivity in construction?
Construction productivity is measured as output (value added, total spending, units built, or square footage) divided by labor hours or employees. It can be tracked at the sector, subsector, project, or task level, with each offering different insights and accuracy tradeoffs depending on what's being benchmarked.
Why has construction productivity declined for decades?
Three primary causes explain the stagnation: rising land-use regulation that keeps firms small and limits investment capacity, limited technological innovation compared to manufacturing, and a fragmented industry structure that reduces incentives for productivity-enhancing capital investment.
How does construction productivity compare across subsectors?
Sharply. In 2024, industrial building construction rose 16%, single-family residential rose 6.1%, multifamily fell 12.8%, and highway/bridge declined for the fourth consecutive year. Treating all construction as one benchmark produces misleading averages.
What is total factor productivity (TFP) and how does it differ from labor productivity?
Labor productivity measures output per labor hour. TFP accounts for all inputs, both labor and capital. In construction, TFP typically shows an even steeper decline because capital investment has grown relative to output — meaning both inputs are being applied less efficiently over time.
Is the construction productivity decline mainly a measurement problem?
No. Deflator and output-mix issues do affect the measured magnitude, and Federal Reserve research suggests mismeasurement may overstate the decline by up to 0.75 percentage points annually. But studies using physical measures (housing units per worker, square footage per employee) confirm genuine stagnation, not just a statistical artifact.
What can construction firms do about productivity challenges?
Firms can't individually change regulatory environments or industry structure. What they can control is how quickly they detect labor slippage, schedule variance, and cost overruns on active projects, catching margin fade while there's still time to intervene rather than documenting losses after the fact.