That gap between "knowing the numbers exist" and "knowing what your numbers mean" is where financial risk accumulates. Lenders and sureties are already benchmarking your firm when they review your financials. The question is whether you're doing the same.
This report covers the key financial and operational benchmarks construction CFOs, finance managers, and advisors should be tracking in 2026 — gross margin by contractor type, net profit by revenue band, WIP health signals, DSO, overhead ratios, and labor productivity. All benchmarks are drawn from current industry data (CFMA, AGC, FMI, BLS) and calibrated to the cost environment contractors are actually operating in right now.
TLDR — Key Findings at a Glance
- Specialty subcontractors averaged 22.4% gross profit margin in 2024 (CFMA); top-quartile firms hit 21.8% across all contractor types
- WIP overbilling vs. underbilling is among the most consequential benchmarks for near-term cash risk — sureties and lenders scrutinize it closely
- Industry-average DSO sits at 55.2 days; subcontractor DSO has climbed to 96 days, up from 90 in 2019
- EBITDA margin averages 8.8% across all construction firms; Best-in-Class performers reach 13.2%
- Reporting lag is the top benchmarking obstacle in 2026 — data that arrives too late to act on is data that doesn't help
The 2026 Construction Market Context: Why These Numbers Matter Now
Margins were already tight before the current cost environment. Now they're under active compression from multiple directions simultaneously.
Material Cost Volatility and Tariff Exposure
According to AGC's January 2026 report, the PPI for materials used in nonresidential construction rose 3.3% from December 2024 to December 2025 — with aluminum mill shapes up 30.5%, steel mill products up 17.0%, and copper up 11.8%. AGC attributed those metal spikes directly to 50% tariffs on imported aluminum, steel, and copper.
The ripple effects are already showing. Earlier AGC data from September 2025 found 43% of contractors reported project cancellations or postponements due to higher costs.
Labor Market Pressure
The workforce problem hasn't eased. The AGC/NCCER 2025 Workforce Survey found:
- 88% of firms employing craft workers had open positions
- 83% said craft positions were as hard or harder to fill than the prior year
- 45% cited labor shortages as the leading cause of project delays
- 95% raised base pay, with average construction wages at $39.69/hour
ABC estimated the industry needed to attract 499,000 net new workers in 2026 — a number that strains hiring pipelines and pushes wage costs higher across every trade.
The Widening Performance Gap
These pressures aren't hitting all firms equally. The CFMA 2025 Financial Benchmarker shows a significant split between average and top-quartile performers for fiscal year 2024:
| Metric | All Companies | Best in Class (Top 25%) |
|---|---|---|
| Net income before tax | 6.7% | 12.0% |
| Return on assets | 12.5% | 29.3% |
| Return on equity | 32.7% | 63.5% |
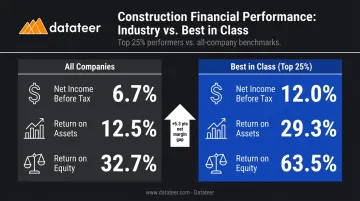
That gap — nearly 5.3 percentage points on net margin alone — is the reason benchmarking matters. Firms that know exactly where they stand can diagnose what's pulling their numbers toward the average — and act before the gap widens further.
Financial Performance Benchmarks: Margins, Overhead, and EBITDA
Gross Profit Margin by Contractor Type
Gross profit margin — revenue minus direct job costs — varies substantially by contractor type, and understanding where your firm fits is the starting point for any performance analysis.
From the CFMA 2025 Financial Benchmarker (fiscal year 2024):
- Specialty Trade contractors: 22.4% gross profit margin
- Best-in-Class across all types: 21.8% gross profit margin
Specialty subs typically carry higher gross margins because their work is more differentiated — proprietary skills, tighter labor markets within specific trades, and less direct price competition on bids. General contractors and industrial/nonresidential contractors tend to trade margin for volume, with lower gross margins offset by larger contract sizes.
What separates top-quartile from median performers? The FMI 2023 Labor Productivity Study found that 62% of the most profitable contractors (operating margin above 4%) had labor cost overruns on only 0–25% of projects — compared to much higher overrun rates among average firms. Protecting field labor efficiency is where gross margin is won or lost.
Net Profit Margin by Revenue Band
CFMA's 2025 data shows net income before tax (as a % of revenue) broken down by segment and revenue size:
| Revenue Band | Industrial & Nonresidential | Heavy Construction | Specialty Trades |
|---|---|---|---|
| $10M–$50M | 4.7%–5.9% | 8.1%–8.6% | 8.0%–8.5% |
| $50M–$200M | 3.9%–4.2% | 8.7%–9.8% | 7.0%–8.3% |
| $200M+ | ~3.4% | ~7.1% | ~7.3% |
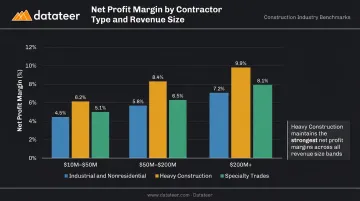
Industrial and nonresidential contractors see net margin compress as revenue scales — larger contract volume doesn't automatically mean better profitability. Heavy construction firms maintain relatively strong margins across size bands, often reflecting infrastructure work's better pricing dynamics. Specialty trades hold up well across revenue bands.
Net margins consistently below 3% in any segment warrant a hard look at overhead structure, field productivity, and WIP management.
Overhead-to-Revenue Ratio
CFMA's 2025 data shows SG&A at 7.3% for Industrial & Nonresidential firms in 2024. Best-in-Class companies carried 10.8% SG&A — which at first seems counterintuitive, but reflects the investment in systems, people, and capabilities that drive their higher revenue and margins.
The risk zone for mid-market firms ($25M–$150M) is during growth phases: when headcount and systems investment outpaces revenue growth, overhead ratios can spike to 15%+ temporarily. That spike is manageable if it's intentional and tracked — dangerous when it goes unnoticed because no one is watching the ratio monthly.
Key overhead benchmarking principles:
- Track G&A as a percentage of revenue monthly, not just at year-end
- Benchmark against firms at your revenue level, not the industry average (smaller firms carry proportionally higher overhead)
- Flag any ratio trending above 12–15% for a firm below $50M in revenue as requiring structural review
Firms tracking these ratios inside their ERP data — rather than waiting for year-end financials — catch overhead creep early enough to act on it.
EBITDA as a Lender and Acquirer Benchmark
EBITDA has become the dominant lens through which lenders, sureties, and private equity buyers evaluate construction firms — largely because it normalizes for depreciation differences between equipment-heavy and labor-intensive contractors.
CFMA 2025 benchmarks for fiscal year 2024:
- All companies: EBIT 7.1%, EBITDA 8.8%
- Best-in-Class (top 25%): EBIT 12.3%, EBITDA 13.2%
Equipment-heavy firms (civil, excavation, heavy civil) carry higher depreciation loads, which depresses net income but leaves EBITDA healthier — making EBITDA a fairer comparison point across firm types.
A specialty contractor with a large owned equipment fleet may show weak net income but healthy EBITDA; a labor-intensive sub with minimal equipment shows the inverse. Both need context before drawing conclusions about financial health.
Backlog Coverage
CFMA 2025 reports backlog in months rather than ratio format:
- All companies: 9.1 months
- Heavy construction: 10.2 months
- Specialty trades: 7.0 months
A useful complementary metric: CFMA's cash management guidance notes that backlog gross profit should exceed 50% of G&A expenses to maintain profitability — a threshold that ties pipeline health directly to overhead coverage.
WIP, Billing, and Cash Flow Benchmarks
WIP Overbilling vs. Underbilling
The WIP schedule is where construction financial health gets real. CFMA 2025 reported underbillings at 8.1% of equity for all firms in fiscal year 2024.
Why does this matter beyond accounting? A heavily underbilled book signals that work has been performed but not yet billed — meaning cash hasn't followed the work. For lenders and sureties, significant underbillings inflate the apparent working capital position while masking a future cash deficit.
NASBP documented a concrete example: underbillings on a late-stage project at 97% complete totaled $296,000, growing to $419,000 by 99% complete — and in a separate case, inflated one contractor's reported working capital by nearly $3 million.
A healthy WIP schedule generally shows:
- Overbillings (billings in excess of costs): Manageable — indicates billing ahead of costs, which is favorable for cash
- Underbillings (costs in excess of billings): Flagged carefully — high underbillings on projects near completion are the most acute risk signal
- Large underbillings on completed or near-complete work: A red flag for collections problems or scope disputes
Tracking these figures in real time matters. Datateer's WIP Reporting module automates percentage complete, earned revenue, billed revenue, and over/underbillings by job — calculations that typically take weeks of manual reconciliation to produce.
Days Sales Outstanding (DSO)
Underbilling risk doesn't exist in isolation — it connects directly to how long it takes to collect what you've earned. DSO is one of the clearest liquidity benchmarks in construction:
- Industry average DSO (CFMA 2025): 55.2 days
- Average subcontractor DSO: 96 days (up from 90 days in 2019)
- 82% of construction companies face payment waits over 30 days (up from 49% two years earlier)
- Median time to pay is approaching 90 days
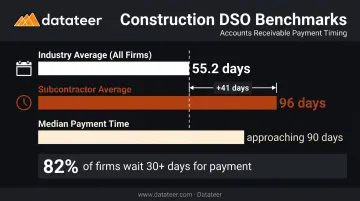
The gap between 55 days (general contractor/owner-level) and 96 days (subcontractor level) reflects the layered payment chain. GCs retain cash while it flows downstream, often protected by pay-when-paid provisions — a structural disadvantage that compounds for specialty trades.
Factors that drive DSO down:
- Fast billing cycle post-period close
- Proactive retainage release management
- Clear contract payment terms with dispute mechanisms
Factors that push DSO up:
- Delayed invoice submission after milestone completion
- Retainage held on substantially complete work
- Owner payment review backlogs and unresolved disputes
Days Cash on Hand and Liquidity Ratios
CFMA 2025 liquidity benchmarks by segment:
| Segment | Current Ratio | Days Cash |
|---|---|---|
| Industrial & Nonresidential | 1.3 | 30 |
| Heavy Construction | 1.9 | 33 |
| Specialty Trades | 2.0 | 22 |
| All Companies | 1.7 | 27 |
CFMA's cash management guidance recommends maintaining enough cash or credit to cover payroll and fixed obligations for at least 2–3 months. Sureties evaluate this alongside working capital, A/R aging, and bank credit availability — meaning your liquidity position directly affects bonding capacity, not just day-to-day operations.
Labor Productivity and Operational Benchmarks
The Scale of the Productivity Problem
The FMI 2023 Labor Productivity Study puts a number on construction's labor efficiency gap: $30B–$40B lost annually to poor productivity. Sixty percent of respondents said 11% or more of field labor costs are wasted or unproductive, and 79% believed productivity could improve 6% or more with better management practices.
The direct financial connection: FMI found average operating profit margin for self-performing contractors at 4%, and 62% of the most profitable firms had labor overruns on fewer than 25% of their projects.
Labor Efficiency Ratio: Actual vs. Budgeted Hours
The labor efficiency ratio — actual hours worked on a project phase divided by originally budgeted hours — is one of the most actionable metrics a construction firm can track. The key word is phase, not just total project.
Firms that track this metric at project close get information too late. By then, the loss is locked in. Firms that track it by phase — concrete work, rough-in, mechanical installation — can identify slippage early enough to intervene:
- Adjust crew sizing before the phase compounds
- Reassign supervision to underperforming areas
- Trigger a change order conversation while scope is still in dispute
Acceptable variance ranges depend on trade and project type, but a variance of more than 10–15% on individual phases warrants investigation before it compounds across remaining work.
Change Order Rate and Margin Recovery
FMI's Keep Score to Reduce Risk analysis documented the margin fade problem in concrete terms: one project estimate started at 9.3% gross margin and finished at 4.2% actual — a 5-point loss largely attributable to change order and scope management failures.
Change orders represent a double-edged dynamic:
- A high change order rate signals scope management challenges and potential estimating gaps
- Under-capturing change orders leaves margin recovery on the table — owners' scope changes become the contractor's loss
- 48% of firms report change order inefficiencies as a persistent drag on margins (FMI 2023)
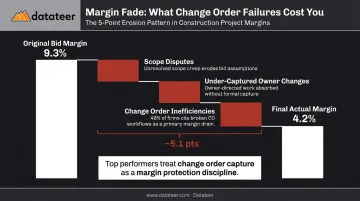
The benchmark goal: price and capture change orders at rates that recover or exceed the original bid margin. Top-performing firms treat change order capture as a margin protection discipline, not an afterthought — and that discipline shows up directly in their project close numbers.
Cost Variance at Project Close
The CII Value of Best Practices data shows how wide the gap is between disciplined and undisciplined project delivery:
| Practice Adoption Level | Average Cost Growth at Close |
|---|---|
| High best-practice adoption | -2.3% (came in under budget) |
| Low best-practice adoption | +8.6% over budget |
FMI's case data breaks down typical variance at project close by cost category:
- Labor: ~17% variance at close
- Equipment: ~10% variance
- Materials and subcontractors: variance driven by contract structure — lump-sum agreements tighten exposure; T&M contracts leave it open
The contract structure point matters: firms that push lump-sum agreements for subcontractor scopes are buying cost certainty, not just administrative preference.
Closing the Benchmarking Gap: Data Infrastructure and Next Steps
All the benchmarks in this report are only useful if a firm can actually see its own numbers with enough frequency and accuracy to compare them. For most construction firms, that's the hard part.
Why Real-Time Benchmarking Is Still Rare in Construction
Construction financial data typically lives across at least three systems: an ERP (Sage, Vista, Acumatica, Foundation), a project management platform (Procore), and a collection of Excel workbooks that connect them. The monthly close process introduces a 10–20 day reporting lag before anyone can see WIP, margin, or cash positions in an integrated view.
By the time the numbers are ready, the window to correct a problem — a labor overrun building on a 60%-complete job, a retainage balance on work that's been done for three months — has often closed.
Double L Management described the before state directly: "That one click replaced two weeks worth of prior work."
The Cost Code Standardization Problem
Even firms with good ERPs face a second obstacle: cost codes and job cost structures vary so widely — across projects, divisions, and certainly across ERP platforms — that producing clean, comparable data requires manual reconciliation every time.
This is why construction benchmarking has historically been an annual exercise — CFMA survey submissions once a year — rather than a continuous management practice. Monthly benchmarking requires clean data flowing in real time. Most firms simply don't have that infrastructure yet.
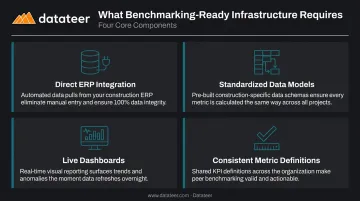
What Benchmarking-Ready Infrastructure Looks Like
A modern benchmarking capability for construction requires:
- Direct ERP integration — automated extraction from accounting and project management systems, eliminating CSV exports and VLOOKUP chains
- Standardized data models — cost code mapping and normalization that makes metrics comparable across jobs and periods
- Live dashboards — WIP, gross margin by job, DSO, overhead absorption, and labor efficiency visible in real time, not after a two-week close cycle
- Consistent metric definitions — so the overbilling calculation in February matches the one in August, without manual intervention
Datateer's construction intelligence platform is one example of infrastructure built to these specifications. It connects directly to 12+ construction ERPs — including Procore, Sage, Viewpoint Vista, Acumatica, and Foundation Software — with pre-built dashboards covering every metric in this report: WIP overbilled/underbilled, gross margin by job, DSO, overhead and burden rates, and labor productivity. Implementation runs 2–4 weeks, with the annual fee starting only once data is flowing.
A Practical Starting Framework
For firms that want to start benchmarking without waiting for full infrastructure to be in place:
- Pick three to five metrics — gross margin by project, WIP overbilled/underbilled ratio, and DSO are the highest-signal starting points
- Establish your current baseline using the most recent full close cycle
- Define "good" using the benchmarks in this report — CFMA segment data is the most directly applicable reference
- Review actuals against benchmarks monthly, aligned with the close cycle
- Track trends, not just snapshots — a gross margin trending from 18% to 15% over six months is a more urgent signal than a single data point below target
The goal in the early stages is directional awareness: knowing whether you're moving toward or away from the top-quartile benchmarks, and catching deterioration early enough to respond.
Frequently Asked Questions
What are typical gross margin benchmarks for construction companies?
Gross margin benchmarks vary significantly by contractor type. Specialty trades averaged 22.4% in fiscal 2024 (CFMA), while industrial and nonresidential contractors run leaner due to higher competition and volume-based bidding. Top-quartile performers consistently outpace median firms by protecting field labor efficiency and capturing change orders at full value.
What is a healthy overhead-to-revenue ratio for a construction firm?
CFMA data shows SG&A around 7–8% for typical industrial/nonresidential firms, with Best-in-Class companies running higher (reflecting investment in capability). The key is tracking the ratio monthly — overhead spikes during growth phases can erode net margin before anyone notices.
How does WIP accuracy affect financial benchmarking?
WIP accuracy directly determines how revenue is recognized and how healthy cash flow appears on paper. High underbillings inflate working capital while masking future cash deficits — a pattern sureties and lenders specifically screen for. CFMA reports underbillings at 8.1% of equity as the 2024 industry average, a figure that directly affects bonding capacity and lender confidence.
What is a good Days Sales Outstanding (DSO) benchmark for a construction company?
The industry average DSO is 55.2 days for all construction firms (CFMA 2025), with subcontractor DSO averaging 96 days due to the layered payment chain. Top performers drive DSO down through fast billing cycles and proactive retainage management. Any sustained DSO above 70–75 days warrants a collections process review.
How often should construction firms update and review their financial benchmarks?
Review key benchmarks monthly, aligned with the close cycle, and reset annual targets each fiscal year using fresh CFMA data (the Financial Benchmarker releases annually). Firms with automated dashboards catch negative trends in real time — before they're locked into a completed project.
Why do most construction companies struggle to benchmark their own financial performance?
The core obstacles are fragmented data systems, manual WIP preparation, and a 10–20 day reporting lag — meaning firms are benchmarking with stale numbers. By the time a problem surfaces, the correction window has often already closed.