Introduction
Construction finance leaders face a question that sounds simple but rarely is: Is our firm generating enough revenue for the headcount we carry? Without a reliable benchmark, the answer is guesswork.
Revenue per employee (RPE) is calculated by dividing total revenue by average full-time equivalent headcount. In construction, that calculation gets complicated fast. A 20-person general contractor managing subcontractors and a 20-person specialty trade firm self-performing the same volume will show wildly different RPE figures, and both can be healthy businesses.
Subcontractor intensity, project mix, contract value, and company size all create natural variation that makes cross-firm comparisons tricky without context.
This article gives construction CFOs, finance managers, and advisors the 2026 benchmarks they need to assess performance, understand what moves this number, and act on the gaps. It covers:
- Sector-by-sector RPE benchmarks for 2026
- The structural factors that explain RPE variation across firm types
- How to diagnose whether a gap signals a real problem
- Practical levers for improving RPE over time
The data draws from the CFMA's 2025 Construction Financial Benchmarker (FY2024 data) and BLS occupational surveys.
Key Takeaways
- The CFMA-reported industry-wide RPE reached $514,587 per FTE in FY2024 — up from $450,086 in FY2023
- RPE varies substantially by firm size; meaningful benchmarking requires comparing within the same size tier
- Heavy subcontractor usage inflates RPE — normalize it before comparing firms
- RPE measures scale, not profitability — pair it with gross margin and payroll-to-revenue ratio
- Monthly rolling reviews catch efficiency trends before they compound into margin problems
2026 Construction Revenue Per Employee Benchmarks
Industry-Wide Average: $514,587 Revenue Per FTE
According to the CFMA's 2025 Construction Financial Benchmarker, which surveyed 1,558 screened construction companies using FY2024 data, the industry-wide average stands at:
- $514,587 revenue per FTE
- $83,554 gross profit per FTE
- 6.7% net income before tax margin
For context, the FY2023 figure was $450,086 per FTE — a 14.3% year-over-year increase, reflecting rising contract values across the sector.
This figure represents the broadest available construction-specific benchmark. It covers general contractors, specialty trades, heavy civil, and industrial firms, so firms should treat it as a starting reference point rather than a target for any single segment.
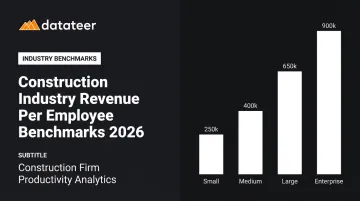
Benchmarks by Company Size
Publicly verified RPE figures broken out by firm size tier aren't available in accessible public sources. What the data consistently shows: RPE scales with firm size. The structural reasons are consistent across industry analysis:
- Larger firms access higher-value project types that smaller firms can't bid competitively
- Overhead leverage improves as fixed G&A costs spread across more revenue
- Estimating discipline and project controls reduce labor waste and improve margin capture
- Repeat institutional clients create more revenue continuity without proportional headcount growth
The inflection point most visible in practice is at the 20–99 employee tier, where firms typically formalize estimating, project management, and financial reporting. That operational shift — moving from owner-driven bidding to systematic project delivery — tends to drive the most significant RPE improvement relative to smaller firms.
Benchmarks by Construction Specialty
CFMA's broad segment data provides the clearest publicly available view of specialty-level performance. FY2024 figures:
| Segment | Net Income Before Tax | Gross Profit Margin | Notes |
|---|---|---|---|
| Heavy Construction | 8.3% | Not publicly disclosed | Highest NIBT of all broad segments |
| Specialty Trades | 7.7% | 22.4% | Verified FY2024 CFMA data |
| Industrial & Nonresidential | 4.4% | Not publicly disclosed | Includes commercial GC activity |
| Best-in-Class firms (all types) | 12.0% | 21.8% (FY2023) | CFMA top-performer cohort |
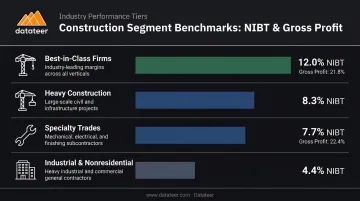
The table above needs context to be useful:
- Heavy civil and infrastructure firms consistently operate at higher NIBT margins, which correlates with stronger RPE — large contract values and capital-intensive structures mean fewer people are needed to generate a given revenue dollar
- Specialty trades show the strongest gross profit margins (22.4%), though their RPE can be lower than commercial GCs because they self-perform more labor
- Commercial GCs vs. residential GCs: Commercial work involves larger contract values, repeat institutional clients, and more complex delivery structures. Exact RPE figures for these two categories aren't available in public sources, but commercial work structurally produces more revenue per employee — higher contract values without proportional headcount growth
Key Factors That Drive (or Drag Down) Construction RPE
Subcontractor Intensity
This is the single most important distortion factor in construction RPE comparisons.
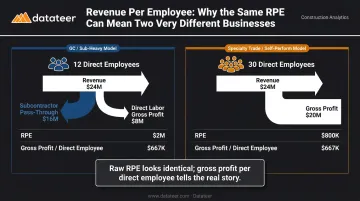
Consider two firms, each with 15 employees:
- Firm A (GC model): Bills $8M annually by managing subcontractors for the majority of work. RPE = $533,000
- Firm B (specialty trade): Self-performs $8M in concrete or mechanical work with the same 15 employees. RPE = $533,000
The number looks identical. The business reality is completely different. Firm A's $8M includes significant subcontractor pass-through — revenue that flows through the firm's books but doesn't represent the productivity of its 15 employees. Firm B's $8M is the output of those 15 people's direct labor.
For sub-heavy firms, the more meaningful metric is gross profit per direct employee — which strips out subcontractor costs before dividing by headcount.
According to CFMA respondent data, roughly 45.5% of survey participants were subcontractors performing 50% or more of work for another contractor, while 37.7% were general/prime contractors or self-performers. These are structurally different businesses and shouldn't be benchmarked against each other using raw RPE.
Project Composition and Contract Value
Two structural factors shape what "good" RPE looks like for a given firm.
Materials vs. labor intensity determines cost structure, not just billing rates. High-materials trades (specialty finishes, glazing, kitchen remodeling) carry more cost in materials than in labor hours. High-labor trades (concrete, framing, utility work) carry the opposite. Because RPE measures revenue against headcount rather than costs, these compositions produce naturally different benchmarks even at identical efficiency levels.
Average contract value has an equally large effect. Firms working on data center builds, healthcare facilities, or institutional campuses generate more revenue per employee than firms doing single-family residential or retail build-outs. Revenue concentration drives this — fewer, larger projects allow the same headcount to produce substantially more revenue. A 50-person firm with three $20M contracts looks very different from a 50-person firm running 80 residential remodels.
Company Stage and Geographic Context
Operational maturity matters more than age. Early-stage firms often hire ahead of revenue during growth phases, which suppresses RPE temporarily. Firms that invest in financial systems, estimating discipline, and project controls tend to sustain higher RPE because they win better-margin jobs and execute them more efficiently.
Geography creates real but often misleading variation. According to BLS Occupational Employment and Wage Statistics (May 2025), construction and extraction workers earn a $65,360 annual mean wage nationally, but that figure varies substantially by metro market. Firms in high-cost metros like San Francisco, New York, or Seattle often show higher RPE — not because their workforce is more productive, but because billing rates reflect local labor costs and market demand. Regional comparisons should account for this inflation effect.
How to Improve Revenue Per Employee in Your Construction Firm
The most durable path to better RPE is growing revenue faster than headcount — not cutting staff. Here's where the real levers are:
Project Selection and Estimating Discipline
- Pursue higher-value contract types: Institutional, healthcare, and industrial projects raise average contract value without requiring proportional headcount growth — even incremental moves up-market shift the ratio
- Apply go/no-go discipline: Low-margin jobs consume field capacity without lifting RPE — firms with rigorous estimating and bid criteria avoid this trap
- Minimize bench time between projects: Underutilized field capacity is the fastest RPE suppressor, even when revenue holds steady
Labor Productivity Management
Labor slippage is a silent RPE killer. When crews run over budget on hours, actual revenue per labor hour drops — and those overruns compound across projects before surfacing in financial statements.
Firms that conduct **regular WIP reviews with field performance data** catch slippage while there's still time to adjust crew composition, scope interpretation, or scheduling. Monitoring labor units vs. budget monthly — rather than at project close — makes a measurable difference. By the time a project closes and the loss surfaces, the opportunity to recover it has passed.
Retention and Workforce Stability
Labor performance continuity depends on keeping experienced people in place. Every departure and backfill creates a productivity gap. Field supervisory roles carry the highest replacement cost because lost institutional knowledge directly affects job execution — crew efficiency, subcontractor coordination, and issue resolution all depend on experience that can't be onboarded in two weeks.
BLS JOLTS data from April 2026 shows 145,000 construction quits monthly, representing a 1.7% quits rate. That level of churn creates a persistent drag on industry RPE, concentrated at the skilled trades and supervisory levels where productivity impact is highest.
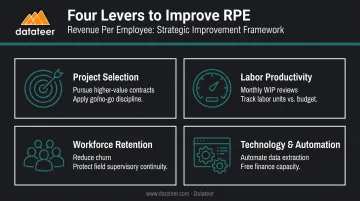
Technology and Automation
Finance and project management teams that spend dozens of hours each month on spreadsheet consolidation, report generation, and WIP calculations are actively prevented from doing strategic work. The problem isn't capacity — it's where that capacity goes.
Platforms that automate data extraction, standardize cost codes, and surface KPIs directly from ERP data allow the same team to support greater revenue volume without adding headcount. One Datateer client noted that "the very first time we accessed our data through a Datateer analytics dashboard, that one click replaced two weeks' worth of prior work."
That's the difference between a finance team perpetually in catch-up mode and one running proactive margin analysis.
Payroll-to-Revenue Ratio and Related Metrics to Track Alongside RPE
RPE tells you how much revenue your workforce is generating. It says nothing about what that workforce costs. That's where payroll-to-revenue ratio becomes essential.
Payroll-to-Revenue Benchmarks
CFMA's FY2024 data provides base payroll and related costs as a percentage of revenue by broad segment:
| Segment | Base Payroll & Related Costs |
|---|---|
| Industrial & Nonresidential | 3.6% of revenue |
| Heavy Construction | 4.4% of revenue |
| Specialty Trades | 7.2% of revenue |
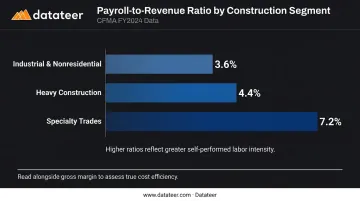
The variation reflects structural differences — GCs passing through sub costs will show lower payroll ratios than specialty trades self-performing labor. A firm can show strong RPE while its payroll-to-revenue ratio climbs, compressing margin without any change in the top-line productivity metric. These two numbers must be read together.
Gross Margin and Overhead Ratio
Gross margin exposes what RPE alone cannot: whether revenue is actually converting to profit. CFMA FY2024 data shows 22.4% gross profit margin for Specialty Trades and 21.8% for Best-in-Class firms (across all types). Revenue productivity and margin quality can diverge significantly depending on cost structure.
Overhead as a percentage of revenue matters for the same reason — firms with growing overhead ratios may show stable RPE while profitability erodes underneath.
RPE vs. Profit Per Employee
These two metrics answer different questions:
- RPE measures workforce scale and revenue output — useful for identifying capacity utilization, hiring efficiency, and project mix quality
- Profit per employee captures what remains after labor costs, overhead, and subcontractor spend — a direct test of whether the business model is actually generating returns
A firm can have strong RPE and weak profit per employee if labor costs, overhead, or subcontractor costs are out of control. Tracking both together shows where revenue productivity ends and true profitability begins — which is the gap that matters most when evaluating hiring decisions or business model performance.
How to Track RPE — and Related KPIs — in Real Time
The Problem with Annual Reviews
Manual RPE calculations — pulling payroll data from one system, revenue from the ERP, and headcount from HR records — introduce a 30–90 day lag by the time the data is compiled and cross-checked. In construction, that lag is costly. Labor slippage compounds over weeks. A project that started overrunning in month two may be unsalvageable by month four if the signal only surfaces at year-end.
Annual snapshots are useful for strategic planning. They're inadequate for operational management.
A Practical Monitoring Cadence
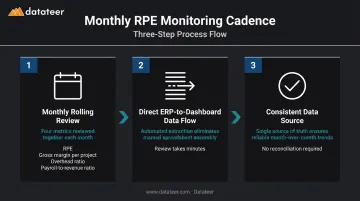
Best-practice RPE monitoring looks like this:
- Monthly rolling review of RPE alongside gross margin per project, overhead ratio, and payroll-to-revenue ratio
- Direct ERP-to-dashboard data flows so the review takes minutes, not days of spreadsheet assembly
- Consistent data source — numbers that come from different reports, pulled at different times, with different definitions, produce unreliable trend data
Platforms like Datateer automate the extraction and cleaning of financial data from construction ERPs — Procore, Sage, Viewpoint Vista, Acumatica, and others — giving CFOs and finance managers live visibility into labor productivity, WIP, margin performance, and related KPIs without manual consolidation.
CSV uploads cover payroll data from standalone HRIS systems not on the standard integration list, so firms with more complex data environments aren't excluded. Implementation typically runs 2–4 weeks from kickoff to live dashboards.
Your Starting KPI Set
Pick five metrics and track them consistently every month from a single data source:
- Revenue per employee (rolling)
- Payroll-to-revenue ratio
- Gross margin per project
- Overhead as a percentage of revenue
- Current ratio
Consistency of source matters as much as consistency of cadence. If your February RPE comes from payroll and your March RPE comes from a different cost report, you're not tracking a trend — you're comparing apples to guesses.
Frequently Asked Questions
What is revenue per employee in construction?
RPE is total revenue divided by average FTE headcount. The CFMA's 2025 Benchmarker puts the FY2024 industry-wide average at $514,587 per FTE, though this varies widely by firm size, specialty, and subcontractor model. Comparing against the industry average without controlling for these variables produces misleading conclusions.
What is a good payroll-to-revenue ratio benchmark for construction?
CFMA FY2024 data shows base payroll ranging from 3.6% (Industrial/Nonresidential) to 7.2% (Specialty Trades) of revenue. The right target depends on your specialty and how much work you self-perform versus sub out. Pair the ratio with gross margin — a firm with a "good" payroll ratio but declining margin has a cost problem elsewhere.
How does company size affect revenue per employee in construction?
RPE scales with size because larger firms access higher-value projects, leverage overhead more efficiently, and apply tighter project controls — so micro firms typically operate well below the industry-wide average while enterprise contractors exceed it substantially. Meaningful benchmarking requires comparing within the same size tier, not against the overall average.
Why does heavy subcontractor use affect construction RPE calculations?
Firms billing significant subcontractor pass-through revenue with few direct employees will show inflated RPE that doesn't reflect internal workforce productivity. A more accurate measure is gross profit per direct employee, which strips out sub costs before dividing by headcount rather than using raw revenue.
How often should construction firms review revenue per employee?
Monthly rolling reviews are the minimum standard for operational usefulness. Annual snapshots are too stale to catch labor slippage or project underperformance before it compounds. Firms with direct ERP-to-dashboard data flows can run this review in minutes rather than days.
Is revenue per employee the same as profit per employee in construction?
No. RPE measures workforce scale and revenue leverage. Profit per employee measures the quality of that revenue after costs. A firm can post strong RPE and still erode margins if labor costs, overhead, or subcontractor expenses are running high. Track both on the same dashboard so neither number masks a problem the other would catch.