Introduction
For many contractors, retainage is the single largest line item of tied-up capital on their balance sheet — withheld per contract, per project, often for 12 to 24 months. The practice of holding back a percentage of each progress payment until project completion sits at the intersection of contract compliance, cash flow management, and financial risk.
For contractors carrying multiple active projects, that withheld retainage compounds fast. Working capital that should be funding the next project sits idle on someone else's balance sheet instead.
What makes 2026 different is that the benchmarks are moving. Legislative reform is accelerating across states, interest rates have raised the real cost of withheld capital, and owners are negotiating more aggressively on rates and release timing.
The 10% default that dominated public and private contracts for decades is giving way to 5%. In several states, that shift is now law, not just negotiation.
For construction finance leaders, knowing where your retainage rates stand relative to current market practice has direct consequences — for cash availability, bonding capacity, and your ability to compete for new work. This guide covers 2026 benchmark rates by sector, state-level legislative changes, release timing norms, and what leading contractors are doing differently to manage retainage exposure.
Key Takeaways
- Standard retainage in 2026 ranges from 5% to 10%, with 5% becoming the norm on private commercial work
- Six states — California, New York, Washington, Colorado, Oregon, and Florida — have enacted statutory caps at 5% for specified contract categories
- GCs routinely withhold more retainage from subs than owners hold from them — and release it later
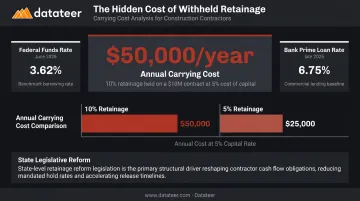
- At a 5% cost of capital, 10% retainage on a $10M contract costs $50,000 per year in carrying costs
- Manual retainage tracking creates blind spots that distort bid pricing and surprise credit line draws
Standard Retainage Rate Benchmarks by Contract Type in 2026
Retainage Rate Ranges Across Contract Categories
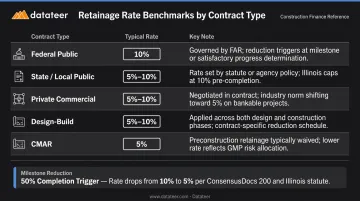
CFMA and Procore both confirm the general U.S. benchmark: retainage typically runs 5% to 10% of each progress payment. But that range masks meaningful variation by contract type.
Here's where rates tend to land in practice:
| Contract Type | Typical Rate | Notes |
|---|---|---|
| Federal public construction | Up to 10% (maximum) | FAR 52.232-5 allows up to 10% only when satisfactory progress has not been made — it is not a blanket default |
| State/local public works | 5%–10% | Many states now cap at 5% by statute (see reform section) |
| Private commercial | 5%–10%, trending toward 5% | 5% is increasingly the negotiated starting point |
| Design-Build | 5%–10% | Rate typically mirrors the prime delivery risk profile |
| CMAR (Construction Manager at Risk) | 5%–10% | CMAR structures often negotiate lower rates due to collaborative delivery model |
The milestone-based reduction has become a common contractual feature. ConsensusDocs 200, Section 9.2.4.1, codifies this approach: once work reaches 50% completion with satisfactory progress, no additional retainage is withheld. Illinois statute (815 ILCS 603/20) mirrors this structure : up to 10% before 50% completion, then no more than 5% thereafter. That statutory framework has become a template — private owners are increasingly using it as a negotiation baseline, giving GCs a concrete precedent to cite when pushing for milestone-based reductions.
Retainage in the GC–Owner Tier
The AIA standard forms deliberately leave rate-setting to the parties. AIA A101-2017 treats retainage as a fill-in term with no published default; AIA A201-2017 governs the payment process but similarly sets no floor or ceiling. What each party negotiates reflects their respective leverage.
In practice, contract size shapes that leverage significantly:
- Contracts above $5M (commercial work): experienced GCs with strong bonding capacity increasingly open at 5%
- Contracts below $5M: owners typically hold more negotiating power and 10% remains common
What the AIA forms do establish clearly is the release mechanism: AIA A101-2017 allows the contractor to submit an application for previously withheld retainage upon Substantial Completion.
Retainage Benchmarks by Project Phase, Sector, and Company Size
When Retainage Is Released: Milestone Benchmarks
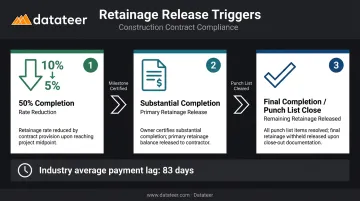
Three contractual triggers govern most retainage release schedules:
- 50% completion — Rate reduction (from 10% to 5%), not full release. Requires satisfactory progress per contract or statute.
- Substantial completion — Primary release trigger under AIA forms. Contractor submits application for retainage held through the project.
- Final completion / punch list close — Remaining retainage released after all punch list items are resolved and final documentation submitted.
The gap between what contracts specify and what actually happens is where cash flow problems live. Levelset's 2019 National Construction Payments Report found average construction payment time running 83 days across the industry — and only 50% of construction businesses were paid within 30 days according to their 2020 follow-up survey.
Retainage release sits at the end of that payment chain. When upstream delays stack up, retainage is where the compounding hits hardest.
State law is beginning to enforce tighter timelines. Key state-level requirements include:
| State | Statute | Release Timeline |
|---|---|---|
| New York | GBS 756-C | No later than 30 days after final approval |
| California | Public Contract Code | Owner pays direct contractor within 45 days after completion |
Retainage Benchmarks by Project Sector and Size
Rates vary by the risk profile and ownership structure of each sector:
- Public infrastructure / heavy civil — Highest rates; public owners default to statutory maximums, often 10% reduced to 5% at 50% completion
- Vertical commercial (office, healthcare, retail) — 5%–10%, trending toward 5% on well-negotiated private contracts
- Residential — Variable; California's SB 61 excludes some residential projects from its 5% cap
- Industrial — Rates typically mirror commercial, though project duration and contract complexity vary considerably by owner type
Project size tracks with negotiating power. Larger GCs with strong bonding capacity can push for reduced retainage rates, milestone-based reductions, or retainage replacement bonds. Smaller firms typically face the full statutory or market maximum — and with less visibility into their retainage aging, the cash impact often goes unquantified until it's already a problem.
The Subcontractor Retainage Gap and GC Pass-Through Practices
How Retainage Flows Down the Payment Chain
The structural problem in retainage isn't just the rate — it's where in the payment chain it lands hardest. Even when an owner holds only 5% from a GC, many GCs hold 10% from their subcontractors using back-to-back or flow-down provisions. The sub absorbs double the cash flow burden of the GC, yet typically holds a fraction of the overall project risk.
Release timing compounds this. GCs frequently do not release sub retainage until after they receive their own retainage from the owner — even if the sub's scope was complete months before the project closes.
A mechanical sub whose work finished at month four of a 24-month project may wait nearly two years for payment on work accepted long ago. For small and mid-sized subcontractors, that sustained working capital drain affects their ability to bid new work, meet payroll, and maintain supplier credit.
Legislative and Contractual Protections for Subcontractors
Several states have extended retainage caps down the full payment chain — not just the owner-to-GC tier:
- California SB 61 (effective 2026-01-01): Caps retention at 5% for private works, applying owner-to-direct contractor, direct contractor-to-subcontractor, and subcontractor-to-subcontractor; lower-tier retainage may not exceed the owner-direct contractor percentage
- New York GBS 756-C: Caps owner, contractor, and subcontractor retainage at 5%; release within 30 days of final approval
- Washington RCW 60.30.010: Owner, contractor, subcontractor, or supplier may withhold not more than 5%
- Colorado CRS 38-46-103: Property owner, contractor, or subcontractor may not exceed 5% of completed work
- Oregon ORS 701.420: Owner, contractor, or subcontractor limited to 5% of contract price of work completed
Standard contract forms add a parallel layer of protection:
- ConsensusDocs 750: Flow-through provision prevents subcontractor retainage from exceeding the prime contract rate
- ConsensusDocs 200: Requires retainage release for early-finishing subcontractor scopes
- AIA A201-2017: Requires contractor payment to subs within 7 days of receiving owner payment, though it sets no default flow-down retainage rate
What's Driving Shifts in Construction Retainage Rate Benchmarks
Three forces are actively reshaping where retainage rates land in 2026.
State legislative reform is the primary structural driver. Over the past five years, California, New York, Washington, Colorado, Oregon, Florida, and Illinois have all enacted retainage caps, milestone-based reduction requirements, or release timeline mandates.
The result is real regional divergence: a GC working across multiple states faces different legal frameworks depending on project location. States without reform laws remain at the older 10% default, while reform states have moved to 5% as the statutory ceiling.
The interest rate effect has changed the financial calculus for both owners and contractors. According to Federal Reserve data, the Federal Funds Effective Rate stood at 3.62% in June 2026, with the Bank Prime Loan Rate at 6.75% as of late 2025. The numbers are direct: 10% retainage on a $10M contract at a 5% cost of capital equals $50,000 per year in withheld capital costs. That figure has pushed owners and GCs alike to reconsider whether 10% retainage is worth the relationship and negotiation friction it creates.
Retainage bonds are gaining traction as an alternative to cash holdbacks, particularly on larger projects. Oregon ORS 279C.560 formalizes this — public contracting agencies must reduce retained money by the value of accepted bonds or securities unless they make a written public-interest finding otherwise. For GCs with strong bonding relationships, substituting a retainage bond for cash holdback eliminates the working capital cost entirely while providing the owner equivalent security.
How Retainage Benchmarks Are Reshaping Construction Cash Flow Management
The Balance Sheet Reality
CFMA notes directly that 5% or 10% of a $10M project is serious money for contractor cash flow. Multiply that across a portfolio of 20 or 30 active projects, and retainage becomes one of the largest line items on a contractor's balance sheet — locked-up capital that constrains bonding capacity, limits the ability to take on new work, and creates dependency on credit lines.
CFMA's reporting also shows subcontractor average DSO climbing to 96 days, up from 90 in 2019. When retainage is embedded in that DSO calculation across multiple project tiers, the actual cash recovery timeline stretches further than most firms track explicitly.
The Operational Problem With Manual Tracking
CFMA has documented the operational reality: tracking schedules of values across different spreadsheets, chasing waiver signatures, and verifying retainage releases manually is labor-intensive, error-prone, and creates gaps in visibility that compound over time.
In practice, a finance team managing 30 active contracts across three project types rarely knows:
- Which retainage buckets are overdue for release
- What the total portfolio exposure looks like by aging category
- Which subcontractors are sitting on unreleased retainage that could be triggering disputes
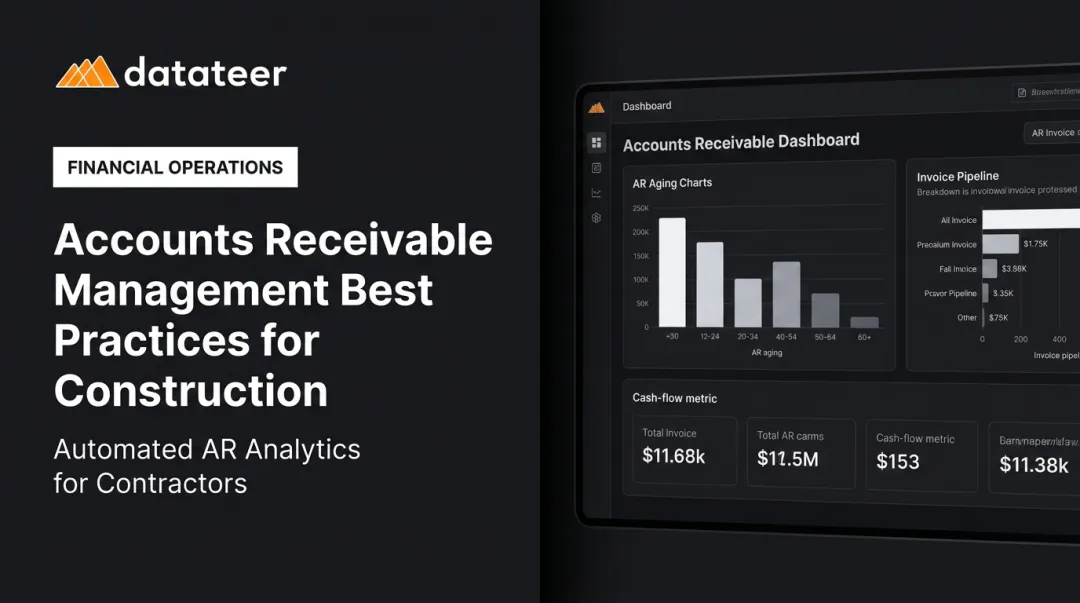
Datateer's Retainage Tracking module separately tracks A/R retainage (held by owners from your firm) and A/P retainage (held by your firm from subcontractors). It integrates with ERPs including Sage 100/300, Viewpoint Vista, Viewpoint Spectrum, Acumatica Construction, Foundation, CMiC, and Procore, syncing overnight so the dashboard reflects current balances without manual exports.
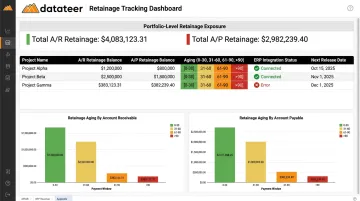
Retainage release schedules feed directly into the 13-week cash flow forecasting module, so treasury teams see the actual liquidity impact of pending releases — not an estimate pulled from contract documents.
The Strategic Cost of Poor Retainage Visibility
When a CFO can't see the retainage pipeline clearly, the downstream effects hit bid strategy and credit management. Firms underestimate their near-term cash recovery and draw on lines of credit to fund working capital needs that would be resolved by retainage releases already contractually due. The credit line cost — at or above prime rate — compounds the carrying cost of withheld retainage that was already contractually recoverable.
Two costs compound here when visibility is missing:
- Credit line interest drawn to cover working capital gaps retainage releases would have closed
- Missed bid capacity — firms that can't quantify their recovery pipeline tend to under-bid or over-leverage on new work
Treating retainage recovery as a predictable input — not a surprise — is what separates reactive cash management from a deliberate liquidity strategy.
Future Signals for Construction Retainage Practices
The trajectory points toward 5% as the de facto standard in private commercial construction over the next three to five years. Several indicators are already in place:
- California SB 61 (effective January 1, 2026) — the largest construction market in the U.S. now caps private retainage at 5%, applying through the full payment chain
- New York SB 5655 (2026) — New York closed a loophole in its 5% retainage law, voiding contract provisions attempting to increase rates above the statutory cap
- ConsensusDocs 200 — already includes a 50% completion stop-retainage provision that voluntary private contracts are adopting as the new negotiation baseline
Technology is now making milestone-based retainage release operationally viable, not just a contract clause. When project management platforms, photo documentation systems, and digital punch lists create an auditable record of scope completion, the contractual trigger for retainage release becomes verifiable without dispute.
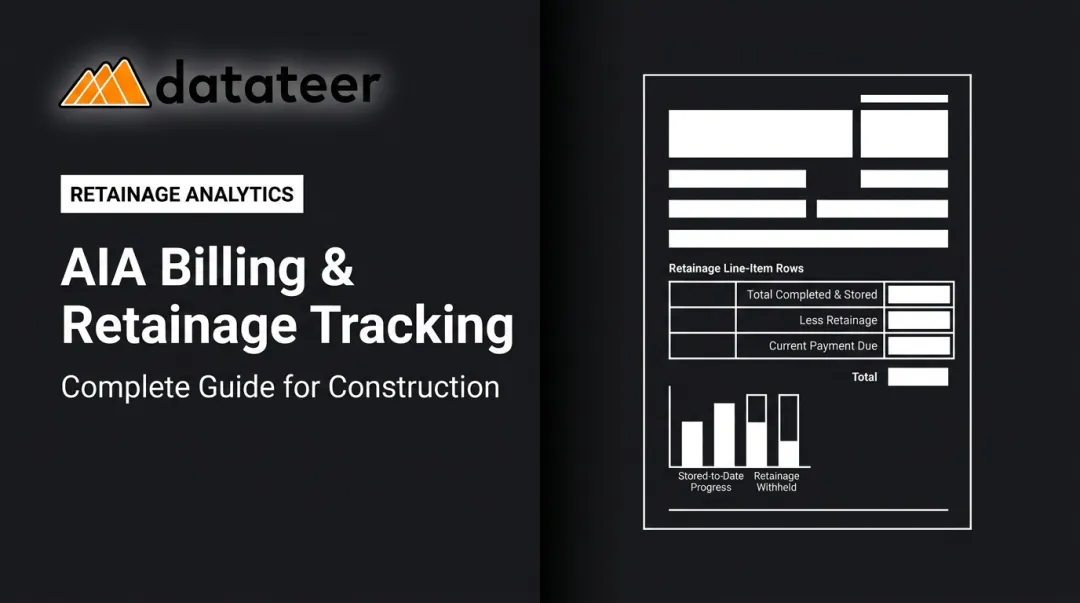
Procore already supports setting and releasing retainage at the line-item level. Firms that build these verification workflows now will hold a negotiating advantage and a cash flow edge as owners become more receptive to milestone-triggered release provisions.
Conclusion
Retainage benchmarks in 2026 are not fixed reference points. Legislative reform is capping rates in the country's largest markets, interest rate conditions have raised the real cost of withheld capital, and contract form practices are shifting to reflect owner and contractor pressure for earlier release. The 10% default is retreating; 5% with milestone-based reduction is advancing.
For construction finance leaders, benchmarking your retainage rates against current market practice is the starting point. The competitive advantage comes from what you do with that information: knowing your total retainage exposure by project, aging bucket, release milestone, and tier (A/R and A/P) before it becomes a liquidity constraint.
Firms with clear visibility into their full retainage pipeline are better positioned to negotiate favorable terms, make informed bid decisions, and recover capital when contracts say they should — not months later. Datateer's Retainage Tracking module gives construction finance teams exactly that visibility, pulling live data from your ERP into dashboards that show exposure by project, subcontractor tier, and release schedule. If you want to see where your firm stands today, the 15-Minute Workflow Audit is a no-pitch starting point.
Frequently Asked Questions
What is 10% retainage in construction?
10% retainage means the owner or GC withholds 10% of each progress payment as security for project completion. While 10% has historically been the standard on public contracts, 5% is increasingly common in private commercial work, and multiple states now cap or restrict the 10% rate by law.
Should I pay a contractor 50% upfront?
Paying 50% upfront is non-standard and generally inadvisable. Typical commercial construction contracts use progress-based payment schedules tied to verified work completed, with retainage withheld as security. On commercial projects, request an itemized schedule of values instead — it protects both parties and is what bonded, experienced contractors expect.
Do general contractors make 10% or 30% of jobs?
GC profit margins are entirely separate from retainage rates. According to CFMA's 2024 Financial Benchmarker, industry net income before taxes averaged 6.3% in 2023, with Best-in-Class firms reporting 21.8% gross margins. The 10%–30% figures circulating online typically reflect gross markup on specific scopes or trade work, not firm-wide net income.
What is the standard retainage rate in construction contracts in 2026?
The market benchmark in 2026 is 5%–10%, with 10% more common on public/government contracts and 5% increasingly standard on private commercial work. Many contracts now include a reduction clause dropping the rate to 5% after 50% project completion.
How does retainage affect subcontractor cash flow?
Subcontractors are disproportionately affected because GCs often hold equal or higher retainage from subs than owners hold from GCs, and frequently delay release until the entire project closes — even when a sub's scope finished months earlier. This creates sustained working capital strain for small and mid-sized subcontractors.
Can retainage rates be negotiated in construction contracts?
Yes, on private contracts retainage rates are negotiable. Experienced GCs and subs negotiate reduced rates, milestone-based reductions, retainage bond substitutes, and scope-completion release provisions. Negotiating leverage depends on firm size, bonding capacity, and how tight the bid market is in your region.