Introduction
When you're managing five to ten simultaneous projects — each with its own WIP schedule, cost-to-complete position, and billing cycle — manual reporting doesn't just slow you down. It leaves you blind at the worst possible moments.
The problem isn't a lack of data. Most firms have plenty of it scattered across ERPs, scheduling tools, and job cost modules. The problem is lag. By the time a budget overrun surfaces in a spreadsheet, the window to correct it has usually closed.
Construction analytics addresses this lag directly — connecting project and financial data into decision-ready insights your team can act on today, not next month. This guide covers the practical benefits: real-time WIP visibility, margin protection, cash flow forecasting, and what firms lose by staying in spreadsheets.
Key Takeaways
- Construction analytics connects ERP data to live dashboards, replacing delayed monthly reports with continuous visibility.
- The three core financial benefits: real-time WIP reporting, proactive cost control, and strategic decision-making.
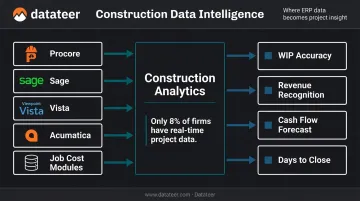
- FMI research finds only 8% of construction firms have real-time project data — most are operating blind between month-ends.
- Margin fade is gradual and silent; analytics catches it while corrective action is still possible.
- Speed matters more than volume: the right data, delivered fast enough to act on, is what separates reactive firms from profitable ones.
What Is Construction Analytics?
Construction analytics is the practice of aggregating data from project management, financial, and field systems — ERPs, scheduling tools, job cost modules — and converting it into decision-ready insights.
In practice, it covers:
- WIP reporting and over/under-billing tracking
- Job costing and cost-to-complete calculations
- Cash flow forecasting and liquidity monitoring
- Labor cost variance and subcontractor spend vs. budget
- Portfolio-level financial oversight across active projects
It's worth separating this from on-site scheduling tools or safety platforms. Construction analytics lives at the intersection of field operations and financial reporting — specifically addressing the lag between what happens on a project and what leadership sees in a report.
The operational outcome matters more than the technology category. When a construction finance manager (CFM) can pull current WIP status without running a manual export, or a project manager can see labor variance against budget without waiting for month-end, leadership can act on current information instead of last month's numbers.
Key Advantages of Construction Analytics for Project Management
The advantages below are grounded in outcomes construction firms actually measure: margin retention, reporting speed, decision quality, and risk exposure. Each advantage compounds when analytics pulls directly from source systems — ERPs, job cost modules, and project data — rather than relying on manual exports.
Real-Time Financial Visibility Across Projects
The ability to see current cost performance, WIP status, and cash flow position on any project at any point in the month — without waiting for the close cycle — changes how decisions get made.
Manual reporting creates a structural problem: by the time budget data is compiled, formatted, and distributed, it's already old. Teams make project decisions on stale figures and discover problems only after the month-end close confirms what the field already knew.
Analytics solves this by pulling data directly from ERP systems and refreshing dashboards automatically. The manual extraction, formatting, and reconciliation work disappears. At Datateer, for example, a Double L Management analyst noted that a single dashboard click "replaced two weeks worth of prior work" — a shift from a laborious manual cycle to instant visibility.
KPIs most affected by real-time visibility:
- WIP accuracy and over/under-billing position
- Revenue recognition timing
- Cash flow forecast accuracy
- Days to close monthly financials
This advantage has the highest impact on firms managing multiple simultaneous projects. A cost problem on one job can erode portfolio-level margins if it isn't surfaced quickly. Datateer's direct integration with 12+ construction ERPs — including Procore, Sage, Vista, and Acumatica — automates this data pipeline, refreshing WIP data overnight (or more frequently when configured) rather than waiting days for a manual report.
Poor data quality has real financial consequences. FMI and Autodesk research estimated bad data cost the global construction industry $1.84 trillion in 2020, including $88.7B in rework costs alone. Real-time visibility is one of the clearest defenses against that kind of preventable loss.
Proactive Cost Control and Margin Protection
Forensic accounting — discovering overruns after the fact — is the default mode for construction firms running manual reports. Analytics shifts that posture to early detection, where labor slippage, budget variance, and margin fade surface while there's still room to respond.
Construction margins leave little room for error. CFMA's 2024 Construction Financial Benchmarker shows Best in Class contractors achieving a gross profit margin of 21.8% and pretax margin of 11.9%. For firms below those benchmarks, even modest overruns on a single project can offset gains across the rest of the portfolio.
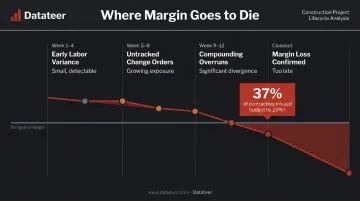
Margin fade is rarely dramatic. It's a 2% labor overrun here, a subcontractor change order that wasn't tracked there — small deviations that compound quietly across a project's duration. Catching a labor variance at week four on a $10M project has a fundamentally different financial outcome than finding it at closeout.
KPMG's 2023 Global Construction Survey found 37% of respondents missed budget or schedule targets by 20% or more — up from 32% in 2021. That trend doesn't reverse without better in-progress visibility.
Datateer's margin protection and cost variance dashboards address this directly. The platform monitors original estimated margin versus current projected margin per job, flags negative variance drivers (labor overrun, material price escalation, subcontractor cost increases), and surfaces the specific cost codes driving deterioration — replacing month-end forensic analysis with continuous oversight.
KPIs most affected:
- Gross margin by project
- Labor cost variance vs. budget
- Cost-to-complete accuracy
- Subcontractor spend vs. contract
- Over/under-billing position
Proactive cost control matters most on long-duration projects, fixed-price contracts, and firms with thin average margins. On those jobs, continuous variance tracking is what separates a course correction from a closeout surprise.
Strategic Decision-Making and Stakeholder Alignment
When analytics handles data collection and reconciliation, construction finance teams shift from compiling numbers to acting on them — a fundamental change in how the function contributes to project outcomes.
Most construction finance teams spend the majority of their month-end cycle on data collection, reconciliation, and formatting — tasks that produce a report rather than an insight. FMI research documents that 49% of construction firms manually transfer data between different software applications, and only 8% have implemented real-time full project management information systems.
That manual burden carries a time cost. Construction teams spend an estimated 13% of working hours — more than 5 hours per week per person — searching for project data.
When analytics standardizes data from multiple systems into consistent, role-appropriate dashboards, a few things change:
- Project managers, CFMs, and executives work from the same numbers, eliminating the "whose data is right" debate
- Finance can shift from compiling reports to identifying trends and advising on project strategy
- Bonding capacity, bid decisions, and resource allocation get made with current information rather than last month's
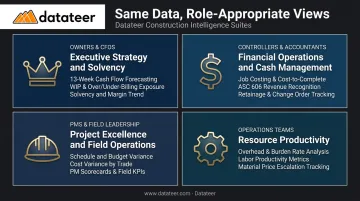
Datateer organizes this around four role-appropriate dashboard suites: Executive Strategy & Solvency (owners and CFOs), Financial Operations & Cash Management (controllers and project accountants), Project Excellence & Field Operations (PMs and field leadership), and Resource Productivity (operations teams). Every user gets the same underlying data, structured for their role — without per-seat fees limiting who has access.
KPIs most affected:
- Report preparation time
- Forecast accuracy
- Bid/win ratio on historically profitable project types
- Stakeholder meeting quality
This advantage is especially valuable for firms growing from $50M toward $200M+ in revenue, where the complexity of a larger portfolio outpaces what spreadsheet-based reporting can manage reliably.
What Happens When Construction Analytics Is Missing
Firms running on manual Excel-based reporting share a familiar pattern: month-end close dominated by data cleanup, WIP conversations built on figures that no longer reflect current project status, and budget decisions made on information that's weeks old.
The risk compounds in specific ways:
- Margin fade is invisible until month-end confirms it — by which point the window to intervene on active projects has closed
- Labor and subcontractor overruns go undetected across multiple jobs simultaneously, with no single view surfacing the pattern
- Over/under-billing positions are miscalculated, creating liquidity exposure that shows up at banking review or audit rather than when it could have been corrected
- Reactive firefighting replaces planning — finance teams spend the month building the report rather than using it
The failure statistics reinforce why this matters. FMI reports inadequate capitalization causes 58% of contractor failures, while Travelers found inadequate internal cost control was a factor in nearly 50% of contractor failures studied. Both trace back to the same root cause: financial problems caught too late to fix.
Those risks compound as firms grow. Without standardized data, institutional knowledge stays locked with individuals. Expanding headcount or portfolio size demands proportionally more manual overhead — more staff, more spreadsheets, more reconciliation work — with no efficiency gained from scale.
How to Get the Most Value from Construction Analytics
Analytics delivers its full value when it's connected directly to source systems and reviewed consistently — not only at month-end or during a crisis.
Conditions that maximize value:
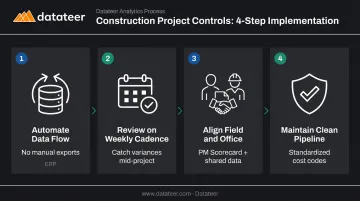
Set up automatic data flow from the ERP into dashboards — no manual exports, no CSV gymnastics. Datateer's 2–4 week implementation handles cost code standardization, broken entries, and cross-system reconciliation before any dashboard goes live.
Review dashboard outputs on a recurring cadence — weekly at minimum. Cost variances caught mid-project have recoverable outcomes. The same variances caught at month-end often don't.
Close the field-office gap by putting project managers, controllers, and executives on the same data. The PM Scorecard module tracks budget variance, margin variance, change order win rate, and earned value per PM, replacing the "whose numbers are right" debate with data-backed accountability.
Keep the pipeline clean. Datateer standardizes cost codes across systems and reconciles Procore project commits to Sage invoices automatically, eliminating the manual VLOOKUP work that corrupts reporting cycles.
Flat annual pricing (starting at $10,000/year per data source) gives the entire team unlimited access to the same data — no per-seat restrictions deciding who can see what.
Conclusion
Construction analytics delivers value when the right data reaches the right people fast enough to act on it — not simply by generating more of it. The advantages compound over time. Firms that build data-driven decision habits into their monthly cadence catch margin fade earlier, manage portfolio risk more confidently, and free finance teams to advise rather than just report.
The firms that benefit most aren't necessarily the largest. They're the ones where finance operates as a strategic function — where controllers and CFOs spend time on forward-looking decisions instead of rebuilding last month's numbers. A quick Construction Data Maturity Audit can show exactly where your firm stands today and what's worth fixing first.
Frequently Asked Questions
What are the advantages of using analytics in project management?
Analytics replaces delayed, manually compiled reports with continuous visibility into cost performance, WIP status, and cash flow. The core benefits are faster reporting, early detection of budget variances, and the shift from reactive firefighting to proactive project management.
What is construction analytics and how does it work?
It involves connecting project and financial data from ERP and management systems — such as Sage, Vista, Procore, or Acumatica — into dashboards or reporting tools. Those outputs are then used to make timely, informed decisions across the project lifecycle.
How does construction analytics improve financial decision-making?
Finance teams stop spending their time compiling numbers and start advising on strategy. With current cost, cash flow, and WIP data available on demand, controllers and CFOs can weigh in on project decisions in real time rather than after the close cycle.
How does construction analytics help prevent budget overruns?
The platform continuously compares actual costs against estimates and flags variances — in labor, subcontractors, and materials — as they emerge. That early detection gives project managers room to intervene before small overruns compound into project-level losses.
What data sources does construction analytics typically connect to?
Most platforms connect to construction ERPs (Sage, Vista, Procore, Acumatica, Foundation, CMiC, Jonas, QuickBooks, NetSuite), job cost modules, labor tracking systems, and project management platforms. The value comes from unifying those sources rather than analyzing each one separately.
Can mid-sized construction firms benefit from analytics, or is it only for large companies?
Mid-sized firms — roughly $10M to $200M in revenue — often have the most to gain. They face the same margin pressures as larger contractors but have less capacity to absorb cost surprises. Modern platforms like Datateer are built to be accessible without requiring a dedicated data team or the 6–18 month timelines typical of generic BI tools.