Introduction
In most industries, a growing backlog means you're falling behind. In construction, it means you're in demand. Backlog is one of the most closely watched financial metrics in the industry because it tells you what the next six to twelve months look like before the revenue hits the income statement.
The problem most firms face isn't understanding what backlog is. It's tracking it accurately. Many CFOs and finance managers still rely on spreadsheet snapshots assembled once a month — pulling data from their ERP by hand, reconciling it, and circulating a report that's already 10–20 days stale.
By then, the pipeline picture has changed.
This guide covers the full picture:
- What construction backlog is and how to calculate it in dollars and months
- What healthy backlog looks like for different firm sizes
- Which factors drive backlog up or down
- The management disciplines that separate firms that see revenue gaps coming from those that don't
Key Takeaways
- Construction backlog = total contracted work not yet completed — your clearest forward revenue signal
- The ABC formula converts backlog dollars into months: Current Backlog ÷ Prior Year Revenue × 12
- Both extremes carry risk — thin backlog signals revenue gaps, excessive backlog signals overextension
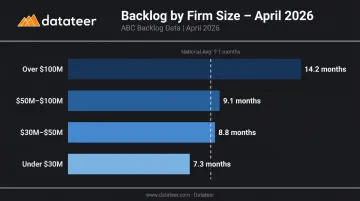
- Firm size matters: in April 2026, firms over $100M carried 14.2 months of backlog vs. 7.3 months for firms under $30M
- Weekly backlog tracking beats monthly snapshots — stale data leads to the wrong decisions
What Is a Construction Backlog?
Construction backlog is the total dollar value of work a firm has under contract but has not yet completed. It includes projects signed and scheduled but not yet started, plus the remaining work on jobs currently underway. Think of it as forward revenue visibility: a committed pipeline of work, not a guarantee of profit.
The word "backlog" carries a negative connotation in most business contexts. In construction, it's the opposite. ABC frames it plainly: "The greater the duration of backlog, the more comfortable contractors can be with respect to their near-term economic circumstances." A growing backlog signals market demand and contractor confidence; a shrinking one is worth investigating before it becomes a cash flow problem.
Is Construction Backlog the Same as WIP?
Related, but not the same.
Backlog is the pipeline — all contracted, uncompleted work, whether a project breaks ground next week or next year. It tells you how much revenue is committed.
Work in Progress (WIP) is an accounting report that tracks the financial health of projects currently underway — costs incurred, billings to date, over-billings, and under-billings. WIP uses the percentage-of-completion method to determine how much revenue from each active project has been earned versus how much remains.
The practical relationship: WIP data validates your backlog figure. The revenue still to be earned across all active jobs — total contract value minus earned revenue — drives an accurate backlog figure. In practice, firms that track WIP rigorously are also the ones with backlog numbers their bankers and bonding agents actually trust.
How to Calculate Your Construction Backlog
The simplest starting point: add up the remaining contract value of every signed but incomplete project. If you have $8M in contracted work left to finish across all active and upcoming jobs, your backlog is $8M. That figure must be updated continuously — every new contract signed and every project completed changes it.
Converting Backlog Dollars into Months of Work
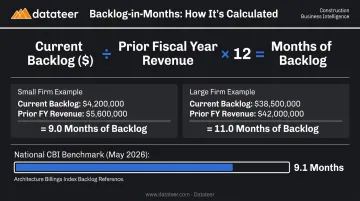
Dollars alone don't tell you much without context. A $5M backlog at a $3M firm represents almost 20 months of work. The same figure at a $50M firm is barely six weeks. That's why ABC's Construction Backlog Indicator (CBI) expresses backlog in months:
Current Backlog ($) ÷ Prior Fiscal Year Revenue × 12 = Months of Backlog
This formula lets you benchmark against industry peers and assess capacity relative to your actual revenue base. The national CBI hit 9.1 months in May 2026 — up 0.7 months from May 2025 — but that average masks enormous variation by firm size and project type.
Measuring Backlog Based on Available Labor Hours
For firms where skilled labor is the true constraint, a labor-based approach can be more meaningful than a revenue-based one. The concept: convert contracted backlog into total labor hours required, then compare against available crew hours. This approach is particularly useful when evaluating a new contract bid — because the real question isn't just "how much is left to bill?" but "do we have the people to deliver it?"
A basic labor-hours backlog calculation requires:
- Total estimated labor hours across all active and committed contracts
- Current crew capacity (available hours per week or month)
- Scheduled project timelines and overlap periods
- Any planned hiring or subcontractor coverage
Both methods share the same underlying vulnerability: backlog is only as useful as it is current. Firms that calculate it once a quarter are making decisions on data that's already obsolete. Traditional spreadsheet workflows — manually exporting ERP data, reconciling it, formatting reports — routinely introduce a 10–20 day lag before the updated picture reaches decision-makers. By then, the project you should have passed on is already signed.
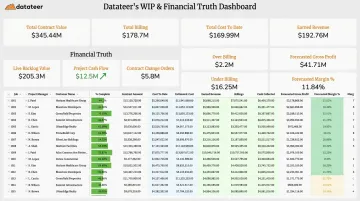
Datateer's WIP & Financial Truth dashboard connects directly to construction ERPs — Sage, Vista, Acumatica, Procore, and others — pulling overnight-refreshed WIP and backlog data automatically. The manual export-reconcile-format cycle gets replaced with a single report pull. One customer, Double L Management, described the shift: "That one click replaced two weeks worth of prior work."
What Makes a Construction Backlog Healthy (or Unhealthy)?
There's no single right number. Healthy backlog depends on firm size, sector mix, and the capacity of your crews and management team.
The national CBI provides a useful reference point. In May 2026, ABC reported the national average at 9.1 months. But the firm-size split from April 2026 reveals how misleading that average can be:
| Firm Revenue | Backlog (April 2026) |
|---|---|
| Over $100M | 14.2 months |
| $50M–$100M | 9.1 months |
| $30M–$50M | 8.8 months |
| Under $30M | 7.3 months |
Project type also moves the needle. ABC reported in May 2026 that contractors with data center work carried 11.6 months of backlog versus 8.6 months for those without it. Infrastructure and multi-year industrial projects naturally produce longer backlogs than light commercial or tenant improvement work, which turns over in months.
When Backlog Is Too Thin
A shrinking backlog creates pressure that compounds quickly:
- Revenue gaps force under-pricing to fill the pipeline on short notice
- Crews go on bench time or get laid off, destroying institutional knowledge
- Lose negotiating leverage with clients and suppliers
- Bonding capacity becomes harder to secure when the pipeline looks thin
When backlog can't sustain normal revenue cycles, cash flow problems follow — and CFMA ties sustained pipeline gaps to elevated contractor failure risk.
When Backlog Is Too Heavy
Overloading the pipeline carries its own risks:
- Crews and management get stretched past their delivery capacity
- Fixed-price contracts lock in revenue at prior pricing while input costs rise — AGC reported nonresidential input costs up 8.4% annually in May 2026, with diesel fuel up over 105% annually
- Long lead times push away new clients
- Missed deadlines damage the reputation that drove the backlog in the first place
Sureties watch this closely. Construction Executive reports that bonding companies typically apply a 10x multiplier to working capital to establish bonding capacity. A backlog that outstrips working capital and management bandwidth signals overextension — and can limit bonding lines at exactly the moment a firm needs them to pursue growth.
Both failure modes — too thin and too heavy — are manageable, but only if you can see the warning signs early enough to act.
What Factors Influence Your Backlog Size?
Economic Conditions and Government Spending
Interest rates and private investment directly affect backlog. When borrowing costs spiked in 2024, construction starts fell 8% in February 2024 to a seasonally adjusted annual rate of $1.07T, with nonresidential building starts down 16%. Projects that pause during rate cycles — private commercial development, office, retail — compress backlog for firms concentrated in those sectors.
Public infrastructure works differently. IIJA-funded programs continue flowing capital into highways, transit, and ports regardless of private-sector sentiment, providing a more stable backlog source for contractors with public-sector exposure.
Where you sit in the market determines how that exposure plays out — and that comes down to sector mix.
Project Complexity and Sector Mix
- Long-cycle sectors (data centers, industrial, infrastructure): generate multi-year backlogs with high predictability
- Short-cycle sectors (tenant improvements, light commercial): turn over in months, requiring continuous new contract wins to maintain backlog levels
Your sector concentration determines not just how long your backlog lasts, but how predictable it is when planning headcount and capital commitments.
Firm Capacity and Client Dynamics
External pressure from clients can shift your backlog without warning. Common disruptors include:
- Schedule changes that push contract execution months out
- Scope creep that extends project duration without proportional revenue
- Delayed owner decisions that stall mobilization
Your own hiring capacity sets a ceiling on how much backlog you can sustainably carry. Signing contracts faster than your crews can execute them erodes margins and damages client relationships — growth that looks good on paper quickly becomes a liability in the field.
Strategies for Managing and Growing Your Construction Backlog
Monitor Backlog Continuously, Not Periodically
Backlog is only useful as a management tool when it's current. Monthly reviews leave executives making decisions on data that reflects conditions from three to five weeks ago — a window wide enough for meaningful revenue gaps to open without warning.
CFMA recommends tracking key financial KPIs daily or weekly. For backlog specifically, that means pulling updated contract values and completion data from your ERP on at least a weekly basis, not assembling a spreadsheet at month-end.
Platforms like Datateer connect directly to 12+ construction ERPs — including Procore, Sage, Vista, Acumatica, and Foundation — and sync data overnight automatically. Finance teams get a WIP and backlog picture that reflects the prior day's activity, not two weeks of manual processing. The backlog ratio is one of 50+ pre-configured KPIs computed directly from ERP data, eliminating the reconciliation cycle.
Align Hiring and Resource Decisions to Contracted Backlog, Not Pipeline Hope
Over-hiring against anticipated work that slips a quarter creates payroll drag that compounds quickly. A practical framework for timing hiring decisions:
- Contract must be signed — not verbally confirmed, not submitted
- Funding must be confirmed — especially for public-sector work with appropriation dependencies
- Award probability must be very high — greater than 80–90% confidence based on documented signals
- Backlog months must support the additional capacity — verify utilization against existing contracted work before committing
Backlog-in-months data gives you the runway visibility to time these ramps confidently rather than reactively.
Use Backlog Data to Sharpen Bidding Strategy
Real-time backlog visibility changes the bid/no-bid decision from a gut call to one grounded in real numbers:
- Strong backlog: pursue higher-margin opportunities; decline marginal work; raise prices selectively
- Thinning backlog: increase bidding activity earlier; widen the opportunity set; prioritize conversion speed
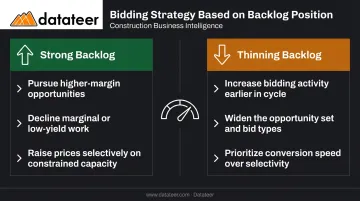
The key word is earlier. Firms that see their backlog trend declining in real time can adjust bidding activity before a gap materializes. Those reviewing backlog monthly often don't adjust until the gap has already landed in the income statement.
Protect Margins on Long-Duration Backlog
Fixed-price contracts locked in at last year's pricing are a margin liability when input costs are rising at 8%+ annually. Practical protections:
- Insert cost-based or index-based escalation clauses for long-duration work
- Lock in long-lead materials early before price increases erode project margins
- Capture scope changes through disciplined change order management before they become absorbed costs
- Re-forecast cost-to-complete regularly — waiting for month-end WIP to surface margin fade leaves few recovery options
Be Selective and Honest About Capacity
The discipline of saying no to work you can't deliver well is more valuable than filling the backlog aggressively. Overcommitting leads to missed deadlines, quality issues, and client attrition — a damaged reputation costs far more than a temporarily thin pipeline.
Firms that consistently deliver on commitments build repeat business and referral pipelines that produce more durable backlog than bidding volume alone.
Frequently Asked Questions
What is a construction backlog?
Construction backlog is the total dollar value of work a firm has contracted but not yet completed — committed future revenue that includes projects not yet started plus remaining work on active jobs. It's typically expressed in dollars or converted into months of work using prior-year annual revenue as the divisor.
Is WIP and backlog the same thing?
No. Backlog is the full pipeline of contracted, uncompleted work. WIP (Work in Progress) is an accounting report that tracks the financial health of active projects — costs incurred, billings, over/under-billings. WIP data feeds into and validates backlog figures, but they serve different purposes.
What is a healthy construction backlog?
It depends on firm size and sector. The national ABC CBI was 9.1 months in May 2026, but firms over $100M averaged 14.2 months while firms under $30M averaged 7.3 months. Compare your backlog months against peers of similar revenue size and project type — the national average is a starting point, not a benchmark.
What are the warning signs of an unhealthy construction backlog?
Both extremes signal risk. Too little backlog (typically below three to four months) suggests impending revenue gaps, forced under-bidding, and potential layoffs. Too much backlog relative to crew capacity and working capital signals overextension and delivery risk, and sureties may constrain bonding lines when they see the imbalance.
How often should a construction firm update its backlog?
At minimum weekly, with daily updates as the gold standard during active bidding cycles. Project completions and new contract awards change the picture continuously — monthly snapshots create dangerous blind spots. Firms with automated ERP integrations can pull updated figures overnight.
How does construction backlog affect bonding capacity?
Surety underwriters review backlog alongside working capital when setting bonding limits. Sureties commonly apply a 10x multiplier to working capital to set maximum bonding capacity — so backlog that outpaces that ceiling directly limits the firm's ability to pursue bonded work.