The problem is structural. According to FMI research, 49% of construction firms manually transfer data between applications, and only 8% of E&C firms have real-time, full project-management information systems that allow dashboard reporting. The rest are running on spreadsheets, manual exports, and stale ERP outputs that create a false sense of control.
A real-time construction project monitoring dashboard changes the equation. It's a live financial intelligence layer that pulls directly from your ERP, consolidates job cost data, WIP positions, labor hours, and billing status, and presents it in a format executives and finance managers can act on — not after close, but now.
This guide covers the full setup process: data readiness, ERP integration, KPI selection, validation, and the most common failure modes to avoid.
Key Takeaways
- The 10–20 day reporting lag is eliminated when your dashboard pulls directly from your ERP on an automated refresh cycle — no manual exports required
- Before setup, you need consistent cost code structures in your ERP and a defined list of financial KPIs your executive team needs
- The highest-signal metrics to track: WIP overbilled/underbilled positions, labor cost vs. budget by job, gross margin by project, and billing curve vs. cost curve
- The most common failure mode: a dashboard that looks live but runs on stale manual data because the ERP integration was never completed
- Reconcile dashboard outputs against known ERP data for 2–3 jobs before trusting the numbers for any decisions
Setting Up Your Real-Time Construction Project Monitoring Dashboard
Dashboard setup in construction finance is not primarily a technology problem. It's a data architecture problem. The technology is only as useful as the underlying ERP data is clean, consistent, and correctly mapped.
Prerequisites and Data Readiness
Before any dashboard tool gets configured, three things need to be in place:
1. Consistent cost code structures across jobs This is the most common blocker. If cost codes vary between projects — or between ERPs after an acquisition — the dashboard will produce misleading comparisons. Cost code normalization is a prerequisite step, not something to fix after go-live.
2. ERP data completeness Are committed costs, labor postings, and subcontractor costs captured in real time, or uploaded in batches? A dashboard can only reflect what the ERP actually contains. Gaps in posting discipline create gaps in dashboard accuracy.
3. The right stakeholders involved from day one
- CFO or finance manager — defines KPI requirements and approves the financial logic
- ERP administrator — confirms data field mappings and access levels
- IT or integration specialist — manages the connection layer between ERP and dashboard platform
Skipping stakeholder alignment at this stage is the single most common cause of dashboard rebuilds. Getting these three parties aligned before setup begins saves weeks of rework.
What to Track: Key Financial Metrics
The most effective construction financial dashboards focus on a short list of high-signal metrics. Surfacing every available data point produces noise, not intelligence. The metrics below have the most direct relationship to margin and cash outcomes.
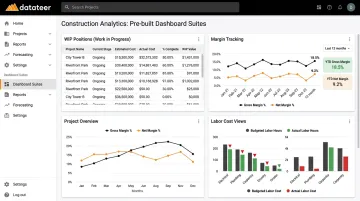
WIP (Work in Progress) Metrics
- Overbilled and underbilled positions by job
- Percent complete vs. percent billed
- Job-to-date cost vs. revised estimate
Real-time WIP visibility changes how CFOs and project managers respond to risk. A monthly WIP report tells you what happened; a live dashboard tells you what's happening. CFMA notes that maintaining realistic, up-to-date WIP information is essential to visibility into current and projected job profitability, cash flow, and backlog — and recommends monitoring key WIP-related KPIs on a daily or weekly basis.
Labor Cost Monitoring
- Actual labor hours and costs vs. budget by job and cost code
- Labor productivity rate (hours per unit)
- Crew efficiency trends
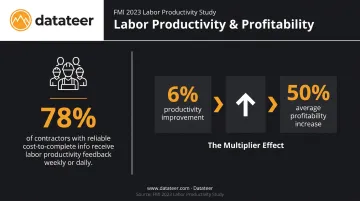
Labor is the fastest-moving cost variable on any job. FMI's 2023 Labor Productivity Study found that 78% of contractors with reliable cost-to-complete information receive labor productivity feedback at weekly or daily intervals — and that a 6% productivity improvement can produce a 50% average increase in profitability.
If you're getting labor feedback monthly, you're too late.
Gross Margin by Project
- Revenue recognized vs. costs incurred
- Forecast-to-complete margin per active job
- Delta between original estimated margin and current projected margin
Catching the gap between bid margin and current projected margin while there's still time to act is one of the highest-value functions a financial dashboard can perform. Platforms like Datateer include dedicated margin protection analytics that flag negative variance drivers (labor overrun, material escalation, change order denial) by specific cost code — replacing month-end forensic analysis with continuous oversight.
Billing and Cash Flow
- Billing curve vs. cost curve by job
- Aging receivables
- Projected cash position and 13-week liquidity forecast
Construction-specific cash timing creates liquidity risk that static reports simply can't flag early enough. Slow payments cost the U.S. construction industry an estimated $299B annually, and cash timing mismatches between cost incurrence and billing collection are a primary driver of that problem.
How to Set Up Your Dashboard: Step-by-Step
Dashboard setup follows a defined sequence. Compressing the data mapping and validation phases produces a dashboard that looks functional but outputs unreliable numbers — and unreliable numbers erode stakeholder trust quickly.
Step 1 — Connect your ERP to the dashboard layer
Establish a direct, automated data connection to your construction ERP. Not a manual export. Not a scheduled CSV upload. A live integration.
Purpose-built construction analytics platforms like Datateer integrate directly with 12+ major construction ERPs — including Procore, Sage, Vista, Foundation, and Acumatica — and handle the data logic and cost code mapping that generic BI tools cannot. Data can be flowing in 2–4 weeks from setup, which is meaningfully faster than the 6–18 month timelines typical of custom BI implementations.
Step 2 — Map and standardize your data
Define how cost codes, job types, and billing categories in your ERP translate to the financial dimensions your dashboard will display. This is where automated extraction and cleaning tools do the heavy lifting — standardizing cost codes, reconciling data between systems (such as Procore commits to Sage invoices), and catching malformed entries before they reach your dashboard views.
Step 3 — Define your KPI views by audience
Build separate views for each audience:
| Audience | Dashboard Focus |
|---|---|
| Executive leadership | Portfolio-level margin, cash position, top jobs at risk |
| Project managers | Job-level WIP, labor vs. budget, change order impact |
| CFO / Controller | Financial close readiness, billing status, forecast-to-complete |
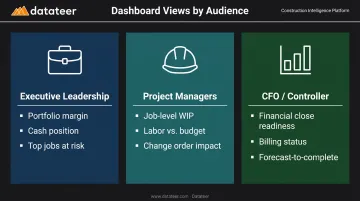
A single dashboard that tries to serve every audience with the same level of detail serves no one well. Datateer's four pre-configured suites — Strategic Health, Cash Operations, Field Performance, and Resource Productivity — map directly to these audiences and are fully configured on day one.
Step 4 — Set refresh frequency and alert thresholds
Configure the dashboard to refresh on a defined schedule. Datateer's standard configuration syncs data overnight, with more frequent updates available based on client requirements. Critically, set threshold-based alerts for margin fade, labor overage, or underbilling that exceed defined tolerances.
Without alerts, a real-time dashboard still requires someone to actively check it. Alerts transform it from a reporting tool into a proactive monitoring system.
Validating Your Dashboard Before Going Live
Validation is the phase teams most often rush — and where the consequences surface months later.
Run a reconciliation check before declaring go-live:
- Pull a known WIP calculation from your ERP or a trusted manual spreadsheet for 2–3 active jobs
- Compare the output to what the dashboard shows
- Any delta signals a mapping error or data lag that must be resolved
Check for data completeness, not just data presence. A dashboard can appear to populate correctly while missing committed costs, unapproved change orders, or labor postings that haven't yet processed through the ERP. These aren't obvious errors — they look like clean data until you compare them against a job you know well.
Why this matters more in construction than in other industries: Incorrect WIP positions can trigger overbilling disputes, distort bonding calculations, and misstate revenue. These aren't just financial errors — they carry legal and reputational exposure. Skipping validation isn't a shortcut; it's a liability.
Common Construction Dashboard Pitfalls and How to Fix Them
Pitfall 1: The Dashboard Looks Real-Time But Data Is Still Manual
Problem: Finance teams set up a dashboard but continue exporting ERP data into Excel and uploading it manually. The dashboard looks live. It isn't.
Cause: The ERP integration was never completed, or the team defaulted to familiar manual workflows because the integration required IT involvement that got deprioritized.
Fix: Establish a non-negotiable rule — the dashboard only pulls from a direct, automated ERP connection. If the integration isn't complete, the dashboard is not production-ready. Platforms that automate ERP extraction remove this risk entirely.
Pitfall 2: Too Many Metrics, No Actionable Signal
Problem: The dashboard shows dozens of data points — cost codes, resource hours, change order counts, weather days — and no one knows what requires action.
Cause: The team skipped the KPI definition step and built the dashboard by surfacing as much data as possible rather than defining what the executive audience needs to act on.
Fix: Audit the dashboard with the intended user audience. Identify the 5–8 metrics that, if they moved in the wrong direction, would require immediate action. Remove or deprioritize everything else. Rebuild each view around the decisions that view is meant to support.
Pitfall 3: Dashboard Doesn't Reflect Mid-Month Job Changes
Problem: The dashboard shows correct numbers at month-end but misses significant mid-month changes — approved change orders, labor overruns, revised estimates — leaving managers with a false sense of job health between closes.
Root cause: ERP posting cycles or approval workflows create a lag between when financial events happen in the field and when they appear in the data layer the dashboard reads.
The fix: Work with your ERP administrator to identify and accelerate the posting workflows creating the lag:
- Move labor cost to daily posting cycles instead of weekly or period-end batches
- Configure the dashboard to flag committed-but-unapproved change orders as a separate indicator, visible before formal approval
- Prioritize any approval workflows that delay financial events from reaching the reporting layer
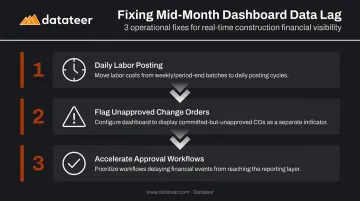
Catching these gaps before month-end turns the dashboard from a scorecard into a management tool.
Pro Tips for Getting the Most From Your Construction Monitoring Dashboard
Three habits separate construction teams that get real value from their dashboards from those who let them go stale.
Build a Weekly Review Rhythm
Schedule a 15-minute dashboard review with project managers — not monthly, weekly. Current data only delivers value when teams have a consistent process for acting on it. Track which actions came out of each review; over time, this paper trail demonstrates what the dashboard caught and what it prevented.
Assign a Named Dashboard Owner
Typically the CFO or finance manager, this person validates data accuracy, manages the ERP connection, and updates KPI definitions as the business evolves. Without a clear owner, dashboards drift out of calibration quietly — small discrepancies accumulate until the team stops trusting the numbers altogether.
Choose Purpose-Built Over Generic BI
General BI platforms like Power BI or Tableau can display construction data, but they require significant custom development to handle construction-specific logic:
- WIP overbilling/underbilling calculations
- Percent-complete methods
- ASC 606 revenue recognition
- Cost-to-complete with committed cost inclusion
- Labor burden rate calculations
Datateer comes pre-loaded with this logic — 50+ construction-specific KPIs already wired to construction ERP data models — replacing what would typically be an 18-month custom BI initiative. Generic BI platforms offer more configuration flexibility, but for construction finance teams that need accurate WIP and revenue recognition on day one, that flexibility comes at the cost of months of custom development work.
Conclusion
A dashboard built on stale or manually processed data doesn't deliver intelligence. It delivers false confidence — and in construction finance, that's more dangerous than flying blind, because at least blind firms know what they don't know.
Approach dashboard setup as a financial infrastructure investment:
- Define KPIs before selecting tools
- Prioritize direct ERP integration over manual workarounds
- Validate rigorously against known source data before go-live
- Build a review rhythm that turns data into decisions
The technology to eliminate that 10–20 day reporting lag exists today. Platforms like Datateer sync directly from construction ERPs overnight and surface pre-built dashboards for WIP, job costing, cash flow, and margin — without a six-month implementation or a data engineering team. The firms that close the reporting gap catch margin fade, labor slippage, and cash timing risk while there's still time to act.
Frequently Asked Questions
What financial metrics should a construction monitoring dashboard track?
The core metrics are WIP overbilled/underbilled positions, labor cost vs. budget by job and cost code, gross margin by project with forecast-to-complete, billing curve vs. cost curve, and aging receivables. Focus on metrics with direct relationship to margin and cash outcomes — not every available data point.
How does a real-time construction dashboard connect to my ERP?
A direct automated integration reads data from your ERP on a defined refresh cycle, eliminating manual exports. Datateer supports 20+ construction ERPs out of the box — including Procore, Sage, Vista, Foundation, and Acumatica — with no manual intervention required once the connection is established.
How long does it take to set up a construction financial monitoring dashboard?
Timelines vary based on ERP complexity and data readiness. Datateer delivers data flowing in 2–4 weeks, with all 12 dashboards active on day one — far faster than the 6–18 months typical of custom BI implementations.
What is the difference between a WIP report and a project monitoring dashboard?
A WIP report is a point-in-time snapshot produced monthly. A real-time dashboard continuously updates WIP positions and flags overbilling or underbilling risks as they develop — giving CFOs and project managers time to intervene before the position is locked in.
Can one dashboard monitor an entire portfolio of construction projects?
Yes. Portfolio-level views are a core feature of construction financial dashboards, allowing CFOs to see aggregate margin, cash, and WIP positions across all active jobs while drilling into individual project detail as needed. Datateer's Executive Strategic Health suite is specifically built for this use case.