Introduction
Construction finance teams sit on more data than ever — cost codes, subcontractor commits, change orders, labor hours, and billing records flowing through ERPs, Procore, and a dozen spreadsheets simultaneously. Turning that data into a usable financial picture still requires days of manual work for most firms.
That lag has a price tag. According to Autodesk and FMI, bad data cost the global construction industry $1.85 trillion in 2020, with bad-data-driven rework alone accounting for $88.69 billion. Meanwhile, only 12% of construction firms consistently incorporate project data into their decisions.
This guide covers what construction business intelligence actually is, its five core components, the financial use cases where it delivers the clearest ROI, and how to evaluate a solution purpose-built for construction.
Key Takeaways:
- Construction BI automates data flow from ERPs to dashboards, cutting manual reporting cycles
- WIP, job cost, and cash flow are the highest-impact starting points for finance teams
- Margin fade is detectable in real time with live, integrated data
- Purpose-built BI platforms go live in 2–4 weeks versus 18+ months for generic tools
- Flat-rate pricing enables firm-wide adoption without per-seat cost friction
What Is Construction Business Intelligence?
Construction business intelligence is the process of collecting, integrating, and analyzing project and financial data from multiple systems to support faster, more confident decisions. Unlike your ERP or a standalone reporting tool, it sits on top of those systems — aggregating what they capture into a unified analytical layer.
The distinction matters. Your ERP records transactions. BI analyzes them across the full portfolio, surfaces patterns, and flags divergences while there's still time to act.
Why Construction Is Uniquely Data-Intensive
Most industries run their financials through a single system. Construction doesn't. Each project is its own P&L, with its own cost codes, subcontractor commitments, change order history, billing schedule, and labor performance data — often split across a project management platform and a separate accounting ERP that don't communicate natively.
The result: finance teams spend enormous time manually reconciling Procore commits against Sage invoices, exporting CSVs, running VLOOKUP formulas, and rebuilding the same reports before every board meeting. JBKnowledge's construction technology research found 62% of construction companies rely on spreadsheets for data collection and 49% manually transfer data between non-integrated applications.
Generic BI tools don't solve this. They're blank canvases — powerful for visualization, but they push all the heavy lifting onto the firm:
- Building every ERP connector from scratch
- Defining every construction-specific KPI without a template
- Maintaining the entire data pipeline indefinitely
That effort routinely runs 18 months and $500,000+ before delivering usable output.
The industry is recognizing the gap. KPMG's 2023 Global Construction Survey found 38% of construction leaders identified advanced data analytics as the technology with the greatest potential to improve ROI — second only to BIM. The pressure is real. The rest of this guide covers how construction-specific BI platforms answer it.
The 5 Core Components of Construction Business Intelligence
Data Integration and Centralization
Effective construction BI pulls data from ERPs, project management platforms, accounting software, payroll, and field tools into a single, unified data layer. Without this foundation, every report is still a manual reconciliation exercise.
The challenge isn't just connecting systems technically — it's cleaning what comes out. Construction data is messy: cost codes that differ between Procore and Sage, subcontractor records with malformed entries, labor hours that haven't been posted through payroll yet.
A purpose-built integration layer handles standardization automatically, not as a one-time project but as an ongoing automated pipeline.
Datateer, for example, integrates directly with 12+ construction ERPs — including Sage, Viewpoint Vista, Acumatica, Procore, Foundation Software, and CMiC — and automatically standardizes cost codes, reconciles cross-system commits, and catches broken entries before they reach a dashboard.
Visualization and Dashboards
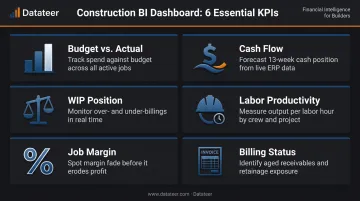
Construction BI converts integrated data into interactive, visual reports that surface the KPIs leadership actually needs:
- Budget vs. actual — job-level cost tracking against original estimate
- WIP position — over/under-billing status across the active portfolio
- Job margin — real-time margin by project, division, or job type
- Cash flow — 13-week liquidity forecasting and billing pipeline
- Labor productivity — crew output against budgeted hours
- Billing status — aging receivables and retainage tracking
The goal isn't to produce prettier spreadsheets. It's to eliminate the need to build reports from scratch each period. Finance teams should open a dashboard on Monday morning and have current data — not spend the week assembling it.
Predictive Analytics
The most valuable capability in construction BI isn't reporting what happened. It's projecting what will happen. Historical project data, when aggregated across a firm's full job history, reveals patterns: which job types consistently overrun labor budgets, which project sizes carry higher margin risk, which change order approval cycles tend to drain profit.
McKinsey's research on capital project execution found average cost overruns of 79% and schedule delays of 52% across large infrastructure projects. Most of those overruns were detectable earlier — the data existed, but it wasn't surfaced until it was too late to act.
Decision-Support and Alerting
Construction BI should function as an early warning system. When actual costs start diverging from estimates — a labor rate running 12% over budget, a subcontractor billing ahead of work-in-place — the system surfaces that signal before it becomes a month-end surprise.
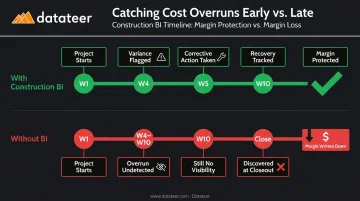
This is the difference between discovering a problem at close and correcting it mid-project. Finance teams that intervene three weeks before a variance locks in protect margin. Teams that find out at close can only explain it.
Governance and Data Quality
BI is only as reliable as the data feeding it. Inconsistent cost codes across jobs, disconnected field and office systems, and years of spreadsheet-based workarounds create a foundation that even the best dashboard can't compensate for.
Effective construction BI requires both a governance framework — standardized cost codes, consistent data entry practices, defined ownership of the source-of-truth — and a platform with automated data cleaning built in. One without the other leaves finance teams chasing data quality problems instead of managing projects.
Key Use Cases for Construction Finance Teams
Replacing the WIP Report Grind
WIP schedules are among the most labor-intensive reports in construction finance. The process — exporting ERP data, building percentage-completion calculations, reconciling billing against earned revenue, reformatting for presentation — eats weeks of finance team time every period.
Datateer compresses this to a near-real-time refresh by syncing directly with the firm's ERP. Double L Management's Business Analyst described the experience directly: "The very first time we accessed our data through a Datateer analytics dashboard, that one click replaced two weeks worth of prior work."
The WIP dashboard surfaces: total contract value, cost to date, earned revenue, billed revenue, over/under-billings, projected gross profit, and forecasted margin — broken down by job, PM, and customer. For surety underwriters and auditors who require accurate, current WIP schedules, this is a material credibility improvement over a manually assembled spreadsheet.
Job Cost Tracking and Margin Fade Prevention
Margin fade — the gradual erosion of profit that goes undetected until project closeout — is one of the most costly and preventable problems in construction finance. Typical E&C margins run 5% to 7%, according to McKinsey. A 10% bid underestimate can make a project a money-loser before ground is broken.
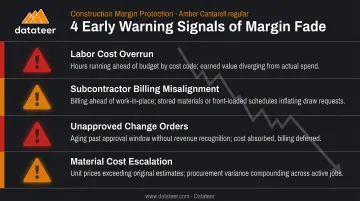
Construction BI catches the early signals:
- Labor costs running ahead of budgeted hours by cost code
- Subcontractor billing misaligned with work-in-place
- Change orders aging past approval without revenue recognition
- Material costs escalating beyond unit price estimates
Datateer's margin protection analytics monitor original estimated margin versus current projected margin per job continuously — flagging negative variance drivers and identifying the specific phases driving deterioration. That means intervention happens while the project is still in progress — not during the post-mortem at closeout.
Labor Productivity and Field-to-Office Visibility
FMI reported that $30–$40 billion is lost annually to poor labor productivity in construction, and 79% of contractors could improve labor productivity by 6% or more with better management practices.
The fundamental problem is timing. By the time labor overruns appear in a financial report, the payroll has closed, the crew has moved on, and corrective action is weeks behind.
Construction BI bridges this gap by surfacing labor productivity metrics — hours burned vs. budgeted, cost-code-level variance, burden rate accuracy — in a shared view accessible to both finance and project management teams. When the same data is visible to both, the conversation shifts from finger-pointing about whose numbers are right to collaboratively addressing the problem.
Cash Flow and Liquidity Monitoring
Levelset's 2021 survey of 764 U.S. construction businesses found only 9% always got paid on time, 20% became cash-flow negative after 40 days, and 30% took out loans due to cash-flow shortages. For firms managing 10–20 simultaneous projects across different clients and payment terms, liquidity risk accumulates invisibly until it becomes a crisis.
Construction BI addresses this through:
- Identifies which projects are cash-generating vs. cash-consuming at the job level
- Surfaces overdue retainage releases tying up working capital
- Flags earned-but-unbilled positions before they become collection problems
- Projects forward bank position based on real-time burn rates (13-week horizon)
Datateer's Forecasted Liquidity dashboard projects the firm's bank balance six months out — what the platform describes as the "CFO's Early Warning System" — so leadership can identify capital needs before they become urgent.
Historical Bid Analysis and Job Type Profitability
When project data is aggregated across a firm's full history, profitability patterns across job types, clients, and contract structures become visible in ways individual project accounting never reveals. Which job types consistently deliver margin? Which client relationships carry disproportionate risk? Which project sizes match the firm's actual operational capacity?
This historical intelligence directly improves bid decisions. Rather than pricing from averages and anecdotal experience, finance teams can segment past performance and bid based on what the data actually shows about where the firm makes money — specifically:
- Job type and contract structure (lump sum vs. T&M vs. GMP)
- Project size relative to the firm's historical win/loss on margin
- Client and PM performance across completed work
- Cost code patterns that consistently run over budget
The Business Benefits of Construction BI
Operational Time Savings
The most immediate benefit is straightforward: automating data flows removes hours of manual work from finance teams each period. FMI's foundational construction research found teams spending 13%+ of working hours just looking for project data — before they'd even begun building a report.
Datateer frames this as the "Excel Tax" — the annual labor cost of manual spreadsheet work. For a two-person finance team spending 40 hours per month on manual reporting at $46/hour, that's $43,846 per year in labor cost allocated to data gathering rather than analysis.
When that cost equals or exceeds a platform subscription, BI isn't an expense. It's a direct improvement to the bottom line.
Improved Profitability and Margin Protection
Early warning alerts, real-time job cost visibility, and historical performance analysis together shift margin management from reactive measurement to active protection. Finance teams stop discovering margin problems at period-end and start correcting them mid-project.
The compounding effect matters. A labor overrun caught in week four is recoverable. The same overrun discovered at closeout is a write-down.
Shifting the CFO from Data Gatherer to Strategic Advisor
When financial data is automatically consolidated and always current, the CFO's job changes. The preparation work disappears: the CSVs, the VLOOKUP marathons, the Wednesday morning apology for numbers already two weeks old. What remains is actual finance work — advising on project strategy, workforce allocation, bid selection, and capital deployment.
That shift, from forensic accounting (looking backward at what already happened) to strategic partnership (shaping what happens next), doesn't happen automatically. But it can't happen at all when manual data prep consumes the week.
Competitive Advantage in Bidding and Bonding
Firms using BI bid with data behind them — actual historical performance on comparable job types, not estimated averages. That confidence shows up in bid pricing, risk assessment, and the ability to walk away from work that data suggests won't be profitable.
For bonding capacity, that data carries equal weight. Surety underwriters reviewing WIP schedules want accurate, current, ERP-sourced numbers — not manually assembled spreadsheets with unclear data lineage. The right documentation package includes:
- Audit-ready WIP schedules with traceable data lineage
- ASC 606 revenue recognition schedules
- Real-time solvency and liquidity metrics
- Over/under-billing summaries by job and division
That level of transparency is what bonding agents and private equity investors are looking for — and what manual reporting rarely delivers consistently.
How to Choose a Construction BI Solution
Construction-Specific ERP Integration
Start with integration depth. Generic BI tools require firms to build custom connectors for construction ERPs — a project that adds months to implementation and ongoing maintenance overhead.
Prioritize platforms with pre-built, direct connectors to the ERPs your firm actually uses. The most common in the U.S. market:
- Sage 100, 300, and Intacct
- Viewpoint Vista and Viewpoint Spectrum
- Acumatica Construction
- Procore
- Foundation Software
- CMiC
- Jonas Construction
- QuickBooks
Pre-built means the data models, cost code structures, and construction-specific KPIs are already wired. Not a blank canvas waiting for a data engineer.
Time-to-Value and Pricing Structure
Two criteria buyers often overlook:
- Implementation timeline: A realistic benchmark for purpose-built construction BI is 2–4 weeks from contract signing to live dashboards. Datateer delivers 12 dashboards on day one across all four strategic suites — no phased rollouts, no module selection. The annual fee doesn't begin until data is flowing.
- Pricing model: Per-user pricing creates friction in construction, where data visibility needs to reach finance teams, project managers, and field leadership at once. A flat annual fee per data source with unlimited users rewards broad adoption instead of capping it.
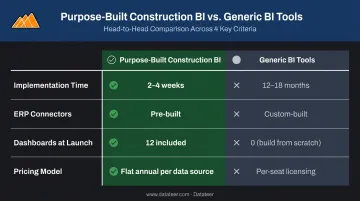
Datateer's pricing starts at $10,000/year per data source with unlimited users, no per-seat licensing, and no per-dashboard fees. The entire 12-dashboard suite is included from day one, with the platform scaling to 50+ reports over the next 12–18 months.
Frequently Asked Questions
What are the 5 components of business intelligence?
The five core components are data integration, visualization and dashboards, predictive analytics, decision-support and alerting, and data governance. In construction, each maps to a specific operational need: integrating ERP and field data, surfacing KPIs visually, forecasting job outcomes, flagging early variances, and maintaining a single trusted data source.
What can AI do for a construction business?
AI enhances construction BI by automating pattern recognition across historical project data: flagging which job types carry elevated risk, catching cost trajectories before they become overruns, and recommending corrective actions before month-end. Unlike traditional descriptive reporting, this shifts the focus from what happened to what will happen if current trends continue.
What is the difference between a construction ERP and construction BI?
An ERP manages transactions — recording costs, invoices, payroll, and project data. BI aggregates and analyzes that data across systems to surface insights. They're complementary: the ERP is the source of record; BI is the analytical layer that makes the data actionable across the portfolio.
What KPIs should construction companies track with business intelligence?
Core construction finance KPIs include: cost variance (budget vs. actual), WIP schedule accuracy, project margin and margin fade indicators, labor productivity (hours per unit), cash flow position, DSO and DPO, retainage aging, change order win rate, and over/under-billing position by job.
How long does it take to implement a construction BI solution?
Purpose-built platforms with pre-built ERP integrations typically go live in 2–4 weeks. Generic BI tools requiring custom configuration routinely take 12–18 months and often fail to deliver usable output. With Datateer, construction-specific data models, cost-code mappings, and ERP connections come pre-built — so firms get live dashboards in weeks, not a year-long implementation project.
How does construction BI help prevent margin fade?
Margin fade compounds quietly: labor overruns accumulate across pay periods, change orders stall while work continues, and subcontractor billing outpaces work-in-place. BI surfaces these signals at the cost-code and phase level so teams can intervene before closeout locks in the loss.