Key Takeaways
- Construction financial statements include four core documents: balance sheet, income statement, cash flow statement, and the WIP report
- Revenue is recognized over time using the cost-to-cost method under ASC 606, not at the point cash is received
- A profitable income statement does not guarantee positive cash flow — all three core statements must be read together
- Underbilling and overbilling positions on the WIP report directly affect both the income statement and balance sheet
- Monthly financial reviews with period-end WIP reconciliation are the minimum cadence for sound financial management
What Makes Construction Financial Statements Unique
Construction stands apart from most industries because revenue recognition, billing, and cash collection rarely happen at the same time. A project can be 60% complete, 40% billed, and 80% collected — all simultaneously. When those three numbers don't align, financial statements can mislead even experienced readers who aren't fluent in construction accounting.
Revenue Recognition Under ASC 606
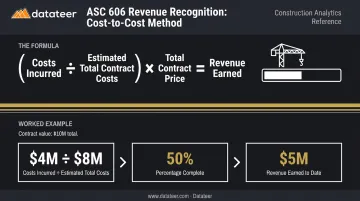
Under current GAAP, most long-duration construction contracts meet the ASC 606 over-time recognition criteria — meaning revenue is recognized as work is performed, not when the contract is complete or when cash arrives. The practical method for calculating this is the cost-to-cost input approach:
(Costs Incurred ÷ Estimated Total Contract Costs) × Total Contract Price = Revenue Earned
For example: if a $10 million contract has $4 million in costs incurred against a $8 million total cost estimate, the project is 50% complete, and $5 million in revenue has been earned — regardless of what's been billed.
When a contract does not meet ASC 606 over-time criteria, revenue is recognized at a single point in time when control transfers to the customer.
Construction-Specific Balance Sheet Items
Two line items appear on contractor balance sheets that don't exist elsewhere:
- Costs in Excess of Billings (CIE) — work earned but not yet billed, treated as a current asset (contract assets under ASC 606)
- Billings in Excess of Costs (BIE) — amounts billed beyond what's been earned, treated as a current liability (contract liabilities under ASC 606)
Both are direct outputs of the percentage-of-completion calculation. Lenders and sureties scrutinize these balances closely — a contractor carrying large underbillings may look profitable on paper while quietly running out of cash to fund work in progress.
The Four Core Construction Financial Statements
Each statement answers a different question:
| Statement | Core Question |
|---|---|
| Balance Sheet | What do we own and owe? |
| Income Statement | Did we make money? |
| Cash Flow Statement | Do we have cash? |
| WIP Report | Are our projects on track? |
Balance Sheet
The balance sheet captures financial position at a specific point in time: Assets = Liabilities + Equity.
For contractors, the key line items include:
- Current assets: Cash, accounts receivable, retainage receivable, and underbillings (CIE)
- Fixed assets: Equipment and property (heavier for civil/heavy contractors than GCs)
- Current liabilities: Accounts payable, overbillings (BIE), and short-term debt
- Long-term liabilities and equity: Owner's equity plus retained earnings
What separates a contractor's balance sheet from a standard one is retainage receivable and the CIE/BIE positions. Lenders and surety underwriters scrutinize these line items closely. NASBP guidelines indicate sureties typically require working capital of roughly 10% of the requested bonding program — large overbillings or questionable underbillings can directly reduce bonding capacity.
Income Statement
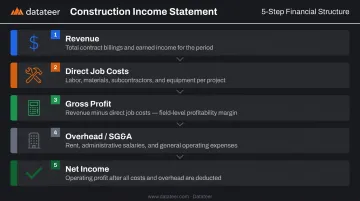
The income statement tracks revenues and expenses over a defined period. Its structure in construction follows this order:
- Revenue — recognized via the cost-to-cost method, not cash receipts
- Direct job costs — labor, materials, subcontractors, equipment
- Gross profit — revenue minus direct costs
- Overhead/SG&A — rent, admin, salaries not tied to specific jobs
- Net income — what remains after all expenses
Gross profit margin (gross profit ÷ revenue) is one of the most actionable metrics on the income statement. CFMA benchmarking data frames 5% as low, 10% as healthy, and 20% as high, with an industry average around 26%. Top-quartile contractors achieved 21.8% gross profit margin in FY 2023 per CFMA's benchmarker.
Monitoring this metric across periods reveals margin fade — the gradual erosion of project profitability — before it becomes unrecoverable.
Cash Flow Statement
The cash flow statement tracks actual cash movement across three categories:
- Operating activities — cash from billings, payments to subs and suppliers
- Investing activities — equipment purchases or sales
- Financing activities — loan proceeds, debt repayments, owner distributions
The critical insight: a profitable income statement does not guarantee positive cash flow. Retainage commonly withholds 5% to 10% of contract value, deferring gross profit until final release. An ENR survey found more than 30% of subcontractor payments from GCs were late, with an average delay of 36.4 days. A growing company can show strong net income while bleeding cash.
That gap is exactly why tracking cash movement separately matters. Most construction firms use the indirect method: starting with net income and adjusting for non-cash items and working capital changes. This approach surfaces cash tied up in unpaid invoices or overbilling positions that the income statement alone won't show.
Work-In-Progress (WIP) Report
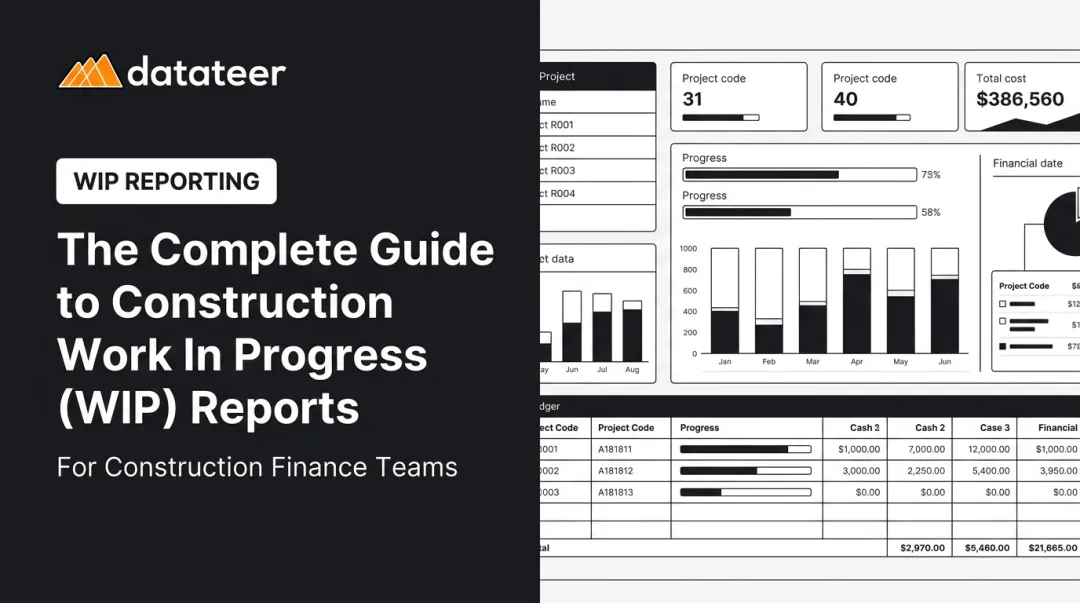
The WIP report is construction-specific. It tracks the financial status of every active project simultaneously, showing:
- Costs incurred to date
- Estimated costs to complete
- Earned revenue (calculated via cost-to-cost)
- Amounts billed
- Resulting CIE (underbilling) or BIE (overbilling) per project
Both billing positions distort the financial statements if the WIP report isn't reconciled to the balance sheet and income statement at period end:
- Overbilling creates a short-term cash windfall but represents work still owed to the owner — a liability
- Underbilling means revenue has been earned but not yet collected, inflating assets and creating future cash pressure
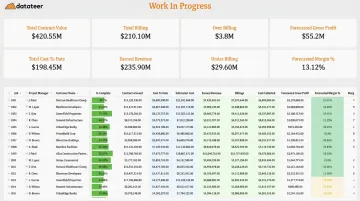
In practice, Datateer's WIP dashboard for one client portfolio showed $192.76M in earned revenue alongside $16.25M in underbillings and $2.2M in overbillings — figures that would be invisible without a properly maintained WIP schedule.
Key Financial KPIs for Construction Companies
Financial statements become most useful when read through specific ratios and metrics. These should be tracked monthly, not just at year-end.
Working Capital
Formula: Current Assets − Current Liabilities
Strong working capital covers payroll, materials, and overhead during slow-paying billing cycles. Per NASBP, sureties typically require working capital equal to roughly 10% of the requested bonding program.
NASBP data also shows working capital as a percentage of revenue rising from 8.3% to 17.8% among $1M–$10M contractors between 2016 and 2025, reflecting tighter liquidity management across the industry.
Days in AR and AP
- AR Days = Average AR ÷ Revenue × 365 — measures how quickly clients pay after billing
- AP Days = Average AP ÷ COGS × 365 — measures how quickly the company pays subs and suppliers
CFMA's FY 2024 benchmarker reports industry averages of 55.2 days in AR and 32.8 days in AP. The gap between these two numbers (over 22 days) represents the working capital strain most contractors carry on every project. A rising AR days trend is an early warning of cash flow pressure worth escalating in your weekly cash review.
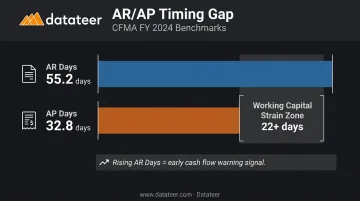
That timing gap also connects directly to the profitability picture: slow collections inflate AR balances, which distort margin calculations until cash actually lands.
Gross Profit Margin and Net Income Percentage
Gross profit margin measures project-level performance; net income percentage measures bottom-line health after overhead.
CFMA's FY 2024 segment benchmarks for net income before taxes:
| Segment | Net Income Before Taxes |
|---|---|
| All respondents | 6.7% |
| Industrial & Nonresidential | 4.4% |
| Heavy Construction | 8.3% |
| Specialty Trades | 7.7% |
Tracking these percentages across multiple periods reveals margin fade before it becomes critical. ENR has noted that WIP can represent 50% or more of annual reported profit, meaning even small WIP errors can materially distort reported profitability.
Underbilling-to-Revenue Ratio
Total underbilling (CIE) as a percentage of revenue is a construction-specific diagnostic that most general financial guides overlook. It also connects directly to the margin picture above: underbilling inflates apparent backlog while hiding true cost exposure. There is no universal industry threshold, but persistently high underbilling may indicate:
- Slow or inconsistent billing processes
- Scope creep being absorbed without approved change orders
- Project cost overruns being obscured in the WIP schedule
Surety Bond Quarterly provides a concrete example: a contractor 90% complete but only 70% billed represents a serious underbilling concern that surety underwriters will flag. NASBP notes that underbillings near project completion (97–99% complete) may be disallowed from working capital calculations entirely if collection appears uncertain.
Common Mistakes That Distort Construction Financials
Three errors show up repeatedly in construction financial statements — each with compounding consequences.
Misclassified job costs corrupt margin data at every level. When direct project expenses are booked as overhead (or vice versa), gross profit margins become unreliable and project-level profitability reports lose meaning. This typically stems from unclear cost code structures or inconsistent data entry across projects. The AICPA identifies it as a primary risk of material misstatement for construction contractors.
Skipping the WIP-to-balance-sheet reconciliation produces fundamentally misstated financials. If CIE and BIE amounts on the WIP report don't tie back to the balance sheet, lenders, surety providers, and internal decision-makers are all working from distorted numbers. This step gets skipped most often in firms still running manual, spreadsheet-based WIP processes.
Confusing profit with cash is the most dangerous mistake of all. A strong net income figure does not mean cash is healthy. Overbilling, unpaid retainage, and rapid growth can each produce a profitable income statement alongside a cash-starved balance sheet. All three financial statements must be read together, not in isolation.
From Manual Spreadsheets to Real-Time Financial Visibility
The traditional WIP reporting process requires finance teams to collect data from multiple project managers, reconcile cost codes across systems, and format reports manually. The result is financial data that's often weeks old by the time decisions get made: one Datateer client called it "autopsy reporting."
Construction analytics platforms like Datateer integrate directly with the ERPs construction firms already use — Procore, Sage, Viewpoint Vista, Spectrum, Acumatica, Foundation Software, CMiC, Jonas, QuickBooks, and NetSuite — to automate the entire data pipeline. Job cost entries flow automatically into the WIP dashboard, which calculates:
- Earned revenue, underbillings, and overbillings per project
- Projected margin by job
- Overnight data refreshes as standard, with current figures available in roughly two minutes
Double L Management's Business Analyst put it plainly: "The very first time we accessed our data through a Datateer analytics dashboard, that one click replaced two weeks worth of prior work."
When finance managers stop spending days collecting and formatting report data, they shift from reactive period-end accounting to proactive identification of margin fade, labor slippage, and liquidity risk — while there's still time to act on those signals.
Frequently Asked Questions
What are the 4 major financial statements?
The four core financial statements for construction firms are the balance sheet (what we own and owe), income statement (did we make money), cash flow statement (do we have cash), and the WIP report (are our projects on track). The WIP report is construction-specific and doesn't exist in most other industries.
What is a P&L in construction?
The profit and loss statement — also called the income statement — summarizes revenues, direct job costs, overhead, and net income for a specific period. In construction, revenue is recognized using the cost-to-cost method under ASC 606, not simply when cash is received.
What is a WIP report and why is it unique to construction?
The WIP report is a project-level document tracking earned revenue, actual billings, and costs for every active job. It's unique to construction because percentage-of-completion accounting creates overbilling and underbilling positions that must be reconciled to the balance sheet each period.
What is the difference between overbilling and underbilling?
Overbilling occurs when billings exceed earned revenue, creating a liability for work still owed to the owner. Underbilling is the reverse — earned revenue exceeds billings, showing up as an asset that represents cash not yet collected. Both distort the financial picture if left unmonitored.
How is revenue recognized on a construction income statement?
Revenue is recognized using the cost-to-cost method under ASC 606: costs incurred divided by estimated total contract costs, multiplied by total contract price. Most long-duration construction contracts qualify for this over-time recognition approach.
How often should construction companies review their financial statements?
Monthly financial statement reviews are the minimum, with WIP schedules reconciled at every period end. Companies using automated reporting tools can monitor key metrics continuously rather than waiting for the monthly close cycle to complete.