Introduction
Construction projects fail financially in slow motion. Cost overruns and schedule slippage rarely announce themselves — they accumulate quietly until a month-end report confirms what the field already knew weeks ago. McKinsey's analysis of 532 global capital projects found average cost overruns of at least 79% and average delays of 52% — numbers that result from tracking cost and time in isolation rather than together.
Earned Value Management (EVM) exists to close that gap. It integrates scope, schedule, and cost into a single performance framework, giving construction finance teams an objective, forward-looking view of where a project is headed — not just where it's been.
What follows gives construction CFOs and finance managers a working foundation in EVM: the core metrics, a commercial construction walkthrough, implementation guidance, and a look at how modern analytics platforms are finally closing the data lag that has historically limited EVM's value in the field.
Key Takeaways
- EVM measures efficiency, not just spending — CPI and SPI reveal whether you're getting value for every dollar and hour invested
- Tracking EVM indices over time turns a snapshot into a trend — and a trend into a decision
- Weak baselines and stale data are the two most common reasons EVM fails in construction
- WIP reporting and EVM are complementary, not interchangeable — one tracks where the money stands, the other tracks where the project is heading
- Automated data sync — not more spreadsheets — is what makes EVM sustainable for construction finance teams
What Is Earned Value Management in Construction?
EVM is a project performance measurement methodology that answers a question simple budget tracking cannot: Are we getting the work done we expected, for the money we've spent?
Traditional budget reviews show whether you've spent more or less than planned. Schedule reviews show whether you're ahead or behind. Neither tells you whether the cost variance is because work is ahead of schedule or because costs are genuinely running hot. EVM integrates all three dimensions — scope, schedule, and cost — into a single framework that makes those distinctions clear at a glance.
EVM vs. WIP Reporting
Construction finance teams often use WIP (Work-in-Progress) reporting and EVM terminology interchangeably. They're related but distinct:
- WIP reporting is an accounting tool — it measures overbillings and underbillings at a point in time, supporting revenue recognition and cash flow visibility
- EVM is a performance management framework — it measures efficiency and projects where the final cost and completion date will land
Both are valuable. WIP tells you where the money stands today. EVM tells you where the project is heading. If you're managing multiple projects simultaneously, you need both.
Where EVM Applies in Construction
EVM works best on projects with defined scopes, phased deliverables, and established cost baselines — which describes most commercial, industrial, and civil construction work.
Federal compliance adds another layer for contractors pursuing government work:
- DFARS policy requires ANSI/EIA-748 compliant EVMS for cost or incentive contracts valued at $20M or more
- DOE capital asset projects above $100M require certified EVMS
At that threshold, EVM moves from a management tool to a bid requirement.
Core EVM Metrics: The Formulas You Need to Know
Every EVM calculation builds on three foundational inputs:
| Input | Definition | Simplified Calculation |
|---|---|---|
| PV (Planned Value) | Budgeted value of work scheduled | Planned % Complete × BAC |
| EV (Earned Value) | Budgeted value of work actually performed | Actual % Complete × BAC |
| AC (Actual Cost) | Actual dollars spent on project work | Direct from ERP/accounting system |
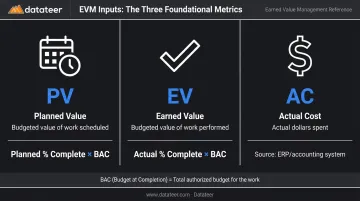
BAC (Budget at Completion) is the total approved project budget established at the start — the denominator for all percentage calculations.
Variance Metrics: Are You On Track?
Variance metrics show the current dollar gap between performance and plan:
| Metric | Formula | Positive | Zero | Negative |
|---|---|---|---|---|
| CV (Cost Variance) | EV − AC | Under budget | On budget | Over budget |
| SV (Schedule Variance) | EV − PV | Ahead of schedule | On schedule | Behind schedule |
Performance Index Metrics: How Efficient Are You?
Indices are more useful than variances for forecasting because they express efficiency as a ratio that can be projected forward:
CPI (Cost Performance Index) = EV ÷ AC
- Above 1.0: earning more value per dollar than planned
- Below 1.0: spending more than the work is worth
SPI (Schedule Performance Index) = EV ÷ PV
- Above 1.0: progressing faster than planned
- Below 1.0: falling behind
Forecasting Metrics: Where Are You Headed?
EAC (Estimate at Completion) projects the final total cost based on current efficiency:
EAC = AC + ((BAC − EV) ÷ CPI)
VAC (Variance at Completion) = BAC − EAC, which projects the final overrun (negative) or underrun (positive) as a single dollar figure.
That number is where EVM moves from math to management. For construction CFOs overseeing multiple projects, EAC converts a CPI trend into a concrete forecast that shapes billing strategy, bonding capacity, and cash flow decisions before the project closes.
EVM in Action: A Construction Project Walkthrough
Here's how these metrics work against a real construction scenario.
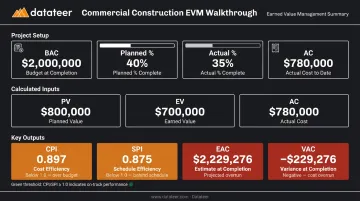
Setup: Commercial build with a $2,000,000 budget (BAC). At the midpoint review:
- Planned completion: 40%
- Actual completion: 35%
- Actual cost spent: $780,000
Step 1: Calculate the Three Inputs
- PV = 40% × $2,000,000 = $800,000
- EV = 35% × $2,000,000 = $700,000
- AC = $780,000
Step 2: Calculate Variance Metrics
- CV = $700,000 − $780,000 = −$80,000 (over budget relative to work earned)
- SV = $700,000 − $800,000 = −$100,000 (behind schedule)
The project is spending more than the work justifies and delivering less work than planned. Both variances moving negative at once signals an efficiency problem, not a temporary scheduling gap.
Step 3: Calculate Performance Indices and Forecast
CPI = $700,000 ÷ $780,000 = 0.897
SPI = $700,000 ÷ $800,000 = 0.875
EAC = $780,000 + (($2,000,000 − $700,000) ÷ 0.897) = $780,000 + $1,449,276 = $2,229,276
VAC = $2,000,000 − $2,229,276 = −$229,276
That projected overrun of $229,276 is surfaced at 35% completion. There are still 65 cents of every budgeted dollar left to spend, and the team now knows exactly how far off course they are before those dollars are gone.
Step 4: What Happens Next
These numbers translate directly into decisions the team can act on today:
- Reallocate labor to lagging work packages
- Accelerate specific scopes to recover schedule
- Update the EAC in owner reporting with a revised completion timeline
- Flag the CPI trend to the CFO for cash flow and bonding implications
At 35% complete, a CPI of 0.897 is recoverable. At 85% complete, the same number is a write-off. The difference is when you look.
How to Implement EVM on a Construction Project
Step 1: Establish a Credible Baseline
EVM only works if your Performance Measurement Baseline (PMB) is solid. That means:
- A fully defined scope
- A time-phased budget (BAC broken into phases and work packages)
- A linked project schedule
A baseline that doesn't reflect what was actually planned makes every metric calculated against it worthless — and weak baselines are the most common reason EVM fails in construction.
Step 2: Build a Work Breakdown Structure
A WBS breaks the project into measurable work packages — the unit at which EV is calculated. Each work package needs to be:
- Tied to cost codes in your accounting/ERP system
- Linked to schedule activities in your CPM tool
- Owned by a single responsible party
The challenge: cost code structures from accounting rarely match WBS elements from scheduling without deliberate mapping. This requires coordination between field, PM, and finance teams — and it's where most construction firms hit friction.
Step 3: Assign Earned Value Techniques by Work Type
Not all work can be measured the same way. Common methods:
| Work Type | EV Technique | Example |
|---|---|---|
| Short-duration tasks | 0/100 or 50/50 milestone | Inspections, submittals |
| Repetitive field work | Units complete | Concrete pours, linear feet of conduit |
| Longer-duration packages | Percent complete with quantifiable backup | Structural steel, MEP rough-in |
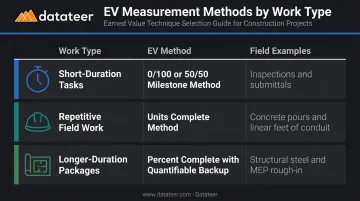
Choose the method that fits the work — not the one that's easiest to report.
Step 4: Collect and Validate Data Consistently
Your EVM output is only as good as what goes in. Progress data must come from the field — foremen, superintendents — and cost data from your ERP or accounting system, on the same reporting cadence. Mixed cadences and inconsistent data sources are the leading cause of unreliable EVM in practice.
Step 5: Calculate, Report, and Act at Regular Intervals
Once your data is consistent, consistent reporting is what makes EVM actionable. Recommended cadence:
- Weekly for active project tracking
- Monthly for portfolio-level review
One snapshot is informative. A sequence of CPI and SPI data points is what enables confident forecasting — you can see whether performance is improving or deteriorating, and adjust accordingly.
Key Benefits of EVM for Construction Firms
Early Warning for Budget and Schedule Risk
EVM's primary value is detecting margin fade and schedule slippage before they become unrecoverable. Early cumulative CPI is a reliable predictor of final cost performance — a finding that holds across decades of defense contract data and translates directly to construction. A CPI trending below 0.9 early in a project warrants immediate management attention.
Objective Basis for Owner Reporting and Change Orders
Arcadis's 2025 North America disputes report found that average construction dispute values in North America increased 40% in 2024 and have nearly doubled since 2021. EVM replaces subjective progress claims with quantifiable performance data — which strengthens your position in owner reporting, lien waiver documentation, and change order negotiations. When scope changes are requested, EVM data shows exactly what impact they have on the performance baseline.
Portfolio-Level Visibility for CFOs
Consistent CPI and SPI calculations across all projects give finance leaders a shared yardstick for comparing project health at a glance — rather than relying on each PM's self-reported status. With standardized metrics in place, CFOs can:
- Prioritize management attention on projects showing early cost or schedule deterioration
- Flag at-risk jobs before they pull down portfolio margins
- Make resource allocation decisions based on objective data, not gut feel
EVM Challenges in Construction — and How Technology Helps
The Data Lag Problem
EVM's most practical limitation in construction is the delay between when work happens in the field and when that data reaches the finance team. Manual job cost entries, Excel WIP schedules, and end-of-month closes can leave EVM metrics 10–20 days stale by the time they're reviewed — often too late for meaningful corrective action.
A Double L Management analyst described their previous process as two weeks of manual work per reporting cycle. After connecting to Datateer, that same report became a single click.
System Fragmentation and Cost Code Inconsistency
Most construction firms keep their data siloed across three separate systems:
- Cost data in their ERP (Sage, Vista, Acumatica, Procore, CMiC, Foundation, Jonas, and others)
- Schedule data in a separate CPM tool
- Progress data in spreadsheets or field reports
None of these connect automatically. Research from PlanGrid and FMI found that 35% of construction professionals' time was spent on non-optimal activities like conflict resolution, rework, and searching for project data, costing the industry more than $177B annually.
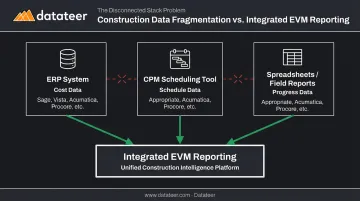
Inconsistent cost code structures across projects compound the problem, making portfolio-level EVM reporting even harder. Datateer's data extraction and cost code standardization engine addresses this directly: it connects to 20+ construction ERPs, reconciles Procore commits to Sage invoices automatically, and maps project data into a unified structure. For firms whose schedule percent-complete lives in a CPM tool outside the ERP, CSV uploads can merge manual schedule data with automated ERP feeds.
Field and Office Adoption
EVM requires buy-in from project managers, superintendents, and finance teams simultaneously. The most effective approach: keep the field-facing process simple (a consistent percent-complete method that foremen can report reliably) while letting finance handle the index calculations. Complexity concentrated at the office level preserves analytical rigor without burdening the field.
Frequently Asked Questions
What is the difference between EVM and WIP reporting in construction?
WIP is an accounting tool that measures overbillings and underbillings at a point in time. EVM is a performance management framework that integrates cost, schedule, and scope to measure efficiency and forecast project outcomes. They're complementary: use WIP for revenue recognition and cash flow; use EVM for project health and trend analysis.
What are the three most important EVM metrics for construction projects?
CPI, SPI, and EAC. CPI and SPI reveal whether a project is getting efficient use of dollars and time, while EAC translates those efficiency trends into a projected final cost — which directly informs cash flow planning, billing strategy, and bonding capacity.
How often should EVM be calculated on a construction project?
Weekly for active project tracking, monthly for portfolio-level review. Cadence matters less than consistency — EVM's forecasting power comes from trending metrics over time. One data point shows your current position. A series of them reveals the trajectory.
Can smaller construction firms benefit from EVM?
Yes. EVM principles scale down effectively. Smaller firms can use simplified versions with fewer work packages and a streamlined percent-complete method — no need for full ANSI/EIA-748 compliance. The core value (early detection of cost and schedule drift) applies to any project with a defined scope and budget.
What is the difference between Cost Variance (CV) and Cost Performance Index (CPI)?
CV is a dollar-denominated gap — how many dollars over or under budget the project is at a given point. CPI is an efficiency ratio — how much value is earned per dollar spent. CPI is more useful for forecasting future performance; CV gives a direct view of current dollar exposure.
What data do you need from your ERP to run EVM calculations?
At minimum: actual costs by cost code (AC), a time-phased budget baseline (for PV), and contract/budget totals (BAC). Most ERPs store this data in formats that require mapping and transformation before EVM metrics can be calculated. That data prep burden is why automated ERP integration is now essential for construction finance teams tracking EVM across a full project portfolio.