This creates what construction finance teams describe as "autopsy reporting": assembling data that's already stale, apologizing for problems nobody saw coming, and spending the first three weeks of every month chasing numbers instead of acting on them. According to FMI, inadequate capitalization drives 58% of contractor failures — a statistic that becomes less surprising once you understand how construction's financial mechanics work.
This guide covers what makes construction financial reporting genuinely different, which reports matter most, the KPIs that reveal true project health, and how firms are replacing the spreadsheet grind with real-time financial intelligence.
Key Takeaways
- Revenue is recognized by percentage of completion — not cash received — so WIP schedule accuracy drives every other financial metric
- Six reports form the core system: WIP schedule, cash flow statement, balance sheet, P&L, AR/AP aging, and job cost/estimates vs. actuals
- CFMA benchmarks show an industry average current ratio of 1.7 and days in AR of 55.2 — key targets for lenders and bonding companies
- The most common reporting failure is reviewing financials too late to change outcomes on active projects
- Automating WIP assembly shifts finance teams from forensic accounting to proactive financial management
What Makes Construction Financial Reporting Uniquely Complex
The Multi-Project Revenue Problem
Most financial reporting frameworks were designed for businesses with a single, unified revenue stream. Construction doesn't work that way. A mid-size contractor might run dozens of active projects simultaneously, each with its own budget, billing schedule, cost codes, contract value, and profit margin.
"Revenue" on any given day depends on how far along three different foundation pours and a steel erection package are — none of which map cleanly to traditional accounting periods.
This is why construction uses the percentage-of-completion (POC) method for revenue recognition under ASC 606. Revenue is earned based on estimated project progress, not on cash received. The practical implication: your P&L can show strong profit on a job that's actually consuming cash faster than anticipated, and the balance sheet can carry underbillings or overbillings that distort the firm's true financial position.
The Cash Timing Mismatch
Even profitable construction firms face a structural cash timing problem that most industries don't encounter:
- Labor and materials get paid before progress billing cycles catch up
- Retainage (typically 5–10% of contract value) is withheld by owners and released only at or after substantial completion
- Change orders approved in one period often don't get billed until a later one
- CFMA benchmark data shows the industry averages 55.2 days in AR, meaning cash collected lags work performed by nearly two months
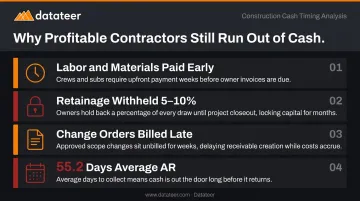
That gap makes cash flow monitoring non-negotiable. A firm can show strong margins on paper and still miss payroll — which is exactly why construction financial reporting demands more than standard accounting frameworks provide.
The Core Construction Financial Reports Every Firm Needs
No single report tells the full story. These six reports work as a system — each illuminating a dimension that the others can't show alone.
Work-in-Progress (WIP) Report
The WIP report is construction's most critical and most distinctive document. It reconciles what has been billed against what has been earned (based on POC), producing two key signals:
- Overbilling (billing in excess of costs): A current liability — the firm has collected more than it has earned and owes future work
- Underbilling (costs in excess of billing): A current asset — the firm has earned more than it has billed, but cash hasn't arrived yet
Banks and bonding companies require the WIP schedule when underwriting credit lines and bonding capacity. Sureties use it to assess whether a contractor's backlog reflects healthy performance or deteriorating margins across active jobs.
The bigger risk is margin fade — a job where expected gross profit erodes as costs accumulate. FMI's research documents direct cost overruns producing a total variance of $5,054,921 on a single project, with labor variance alone accounting for $7,487,573. A project that's 60% complete but has burned through 75% of its budget needs intervention now, not a month-end review.
Cash Flow Statement
Slow-pay owners and retained funds can drain a construction firm's checking account even when the P&L looks healthy. The cash flow statement — tracking operating, investing, and financing activities — is what separates firms that survive those gaps from firms that don't. A company can show positive net income on its P&L while its checking account runs dry. Delayed owner payments and retained funds create real liquidity gaps that the income statement completely masks.
Balance Sheet
Construction balance sheets carry items you won't find in most industries:
- Underbillings appear as current assets (earned but not yet billed)
- Overbillings appear as current liabilities (billed but not yet earned)
- Retainage receivable sits as a separate line item — money earned but contractually withheld
Lenders and sureties scrutinize the balance sheet heavily when evaluating bonding capacity or lines of credit.
Income Statement (P&L)
The construction P&L shows revenue, direct job costs (labor, materials, subs, equipment), gross profit, overhead, and net income. Gross profit margin is the most closely watched metric — and the benchmark matters. CFMA's 2025 Construction Financial Benchmarker, drawing on fiscal 2024 data from 1,558 analyzed companies, reports:
- Specialty Trades averaged a gross profit margin of 22.4%
- Best-in-Class companies across the industry achieved 21.8% in the prior year
Aged AR and AP Reports
The AR aging report buckets unpaid invoices by time:
| Bucket | Risk Level |
|---|---|
| 0–30 days | Low |
| 31–60 days | Monitor |
| 61–90 days | Escalate |
| 90+ days | Collection risk — act immediately |
The AP aging report tracks what the firm owes vendors and subcontractors, enabling payment timing that preserves vendor relationships without straining cash flow.
Job Cost / Estimates vs. Actuals Report
This report compares budgeted costs by cost code — labor, materials, subcontractors, equipment — against actuals on every active job. Consistent variances across multiple projects don't signal a project management problem; they signal a systemic estimating or operational issue. This report is the only way to tell the difference and improve bid accuracy over time.
Key Financial KPIs and Ratios to Track
Raw financial reports tell you what happened. Ratios tell you what it means — and whether your firm is positioned to grow, borrow, or bond. CFMA organizes construction financial KPIs into three core categories: liquidity, profitability, and efficiency.
Liquidity Ratios
These are the first metrics bonding companies and lenders examine:
- Current Ratio (current assets ÷ current liabilities): CFMA 2025 all-company benchmark is 1.7
- Quick Ratio (same, excluding inventory): CFMA benchmark is 1.4
- Days of Cash: How many operating days the firm can sustain on current reserves
Profitability Ratios
- Gross Profit Margin: Revenue minus direct costs, divided by revenue
- Operating Profit Margin: After overhead, before interest and taxes
- Net Profit Margin: Bottom-line measure; CFMA reported all-company net income before taxes at 6.3% in fiscal 2023
Tracking these monthly — not just at year-end — lets leadership catch pricing problems or cost overruns while there's still a chance to course-correct.
Efficiency Metrics
Efficiency ratios reveal how well the firm converts revenue into cash — and how much breathing room it has between collecting from owners and paying subs and suppliers.
| Metric | Formula | CFMA 2025 Benchmark |
|---|---|---|
| Days in AR | (Average AR ÷ Revenue) × 365 | 55.2 days |
| Days in AP | (Average AP ÷ COGS) × 365 | 32.8 days |
| Working Capital Turnover | Total Sales ÷ Working Capital | 7.4 |
One critical caution: a very high working capital turnover can look efficient but may signal undercapitalization — running too lean to support growth. These ratios must be read in context of project backlog, bid pipeline, and market conditions, not in isolation.
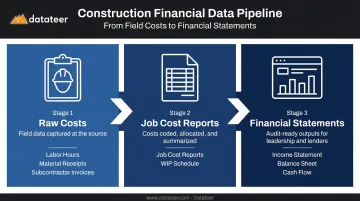
How Job Cost Data Flows Into Financial Statements
Every financial statement in construction originates from job cost data collected at the project level. The data pipeline works like this:
- Raw costs (labor hours, material receipts, subcontractor invoices) flow into job cost reports
- Job cost reports feed the WIP schedule
- WIP data populates the income statement (via POC revenue recognition), the balance sheet (via overbilling/underbilling balances), and the cash flow statement (via changes in AR, AP, and retainage)
Where the Pipeline Breaks Down
In most construction firms, this pipeline runs through Excel. Field management systems use one set of cost codes; the ERP uses another. Finance manually reconciles the two. The result is data that's 2–3 weeks stale by the time it reaches the Wednesday morning executive review — when leadership is making project decisions based on conditions that no longer exist.
According to JBKnowledge's Construction Technology Report, 67% of construction firms named spreadsheets as their most important software. That same survey found 53.6% of firms reported their accounting and ERP functions depend heavily on spreadsheets — creating the exact fragmentation problem described above.
Fragmented, inconsistently coded, and delayed data is the root cause of most construction financial reporting problems — not a lack of knowledge about which reports to run. Firms that fix the pipeline can spot margin fade, underbilling, and cash crunches before they become crises.
Best Practices for Construction Financial Reporting
Maintain Dual-Level Reporting
Always run both project-level and company-level financial views. Project-level reports reveal which jobs are profitable and which are bleeding. Company-level reports show aggregate financial health. Relying solely on company-level reporting is how one large underwater job quietly consumes working capital while the firm's aggregate numbers still look acceptable.
Separate Financial Duties
The person entering invoices should not be the same person approving payments. At smaller firms, a project manager or owner can handle review responsibilities. Beyond reducing fraud risk, this practice supports credibility with external lenders and bonding companies during underwriting.
Build a Forward-Looking Cash Flow Forecast
The cash flow statement tells you what happened. A forecast predicts what's coming — and in construction, that distinction matters. Effective construction finance teams model expected cash positions using:
- Project billing schedules
- Retention release timelines
- Upcoming subcontractor payment obligations
This prevents the scenario of having strong backlog but insufficient cash to fund the next project phase — one of the most common liquidity traps in construction.
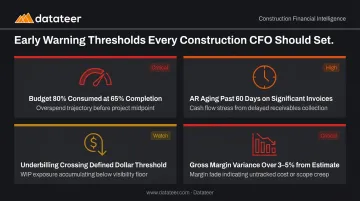
Set Threshold-Based Warning Signals
Without predefined triggers, teams miss warning signs until month-end review. Specific thresholds worth monitoring:
- A project that has consumed 80% of its budget but is only 65% complete
- AR aging past 60 days on any significant invoice
- Underbilling on a specific job crossing a defined dollar threshold
- Gross margin variance of more than 3–5% from the original estimate
Make Reports Scannable and Drillable
The best construction financial reports surface critical metrics first: project margin, billing status, and cash position. Stakeholders should be able to drill into detail on demand — not hunt for it.
A report that opens with 40 lines of cost code detail before showing the overall job margin forces the reader to do analysis the report should handle automatically.
Moving Beyond Spreadsheets: Automated Construction Financial Intelligence
The Excel Trap
Most construction firms outgrow spreadsheet-based reporting long before they recognize it. The warning signs are familiar:
- One person "owns" the reports and becomes a single point of failure — when they leave, the reporting infrastructure goes with them
- WIP schedules require days of manual assembly each month
- Executives review job data that's already 3 weeks old
- Formulas break when someone edits a cell
- Procore-to-Sage reconciliation eats entire weekends before board meetings
The hidden cost is quantifiable. A typical scenario — 40 hours per month across two staff at a loaded rate — translates to roughly $43,846 annually in what Datateer calls the "Excel Tax." That's before accounting for the strategic cost of decisions made on stale data.
What Modern Construction Financial Intelligence Looks Like
The alternative to spreadsheet-based reporting is a system that connects directly to the ERP, cleans and standardizes data automatically, and delivers financial reports that refresh themselves.
Datateer is a financial operating system built specifically for construction — not a generic BI tool adapted to fit. It integrates directly with major construction ERPs including Procore, Sage, Viewpoint Vista, Viewpoint Spectrum, Acumatica Construction, Foundation Software, CMiC, and Jonas Construction, among others.
Datateer is a financial operating system built specifically for construction — not a generic BI tool adapted to fit. It integrates directly with major construction ERPs including Procore, Sage, Viewpoint Vista, Viewpoint Spectrum, Acumatica Construction, Foundation Software, CMiC, and Jonas Construction.
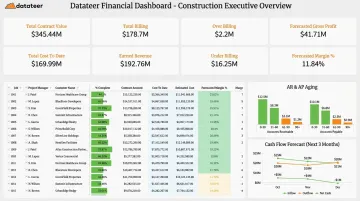
The platform delivers a complete dashboard suite covering:
- WIP and over/under-billings
- AR/AP health and aging
- Job cost and cost-to-complete
- 13-week cash flow forecasting
- Margin fade detection and retainage tracking
- ASC 606 revenue recognition analytics
The practical outcome: the WIP assembly process that previously took two weeks now happens in a single click. As one business analyst at Double L Management put it: "The very first time we accessed our data through a Datateer analytics dashboard, that one click replaced two weeks worth of prior work."
That kind of time recovery compounds fast. Implementation takes 2–4 weeks, and the annual subscription — starting at $10,000 per year per data source with unlimited users — begins only once data is flowing.
The Strategic Shift for CFOs
When finance teams stop spending three weeks assembling data, they start doing what CFOs are actually hired to do:
- Identifying which jobs need intervention before margin fade is locked in
- Monitoring subcontractor payment risk in real time
- Positioning the firm's balance sheet for the next bond or credit facility
- Turning the Wednesday morning meeting from a data-apologizing session into a strategic conversation
The shift is less about saving hours and more about what replaces them — earlier intervention on troubled jobs, sharper conversations with lenders, and financial decisions grounded in this week's numbers rather than last month's.
Frequently Asked Questions
How is financial reporting in construction different from other industries?
Construction firms run multiple concurrent projects, each with its own budget, billing schedule, and cost structure. Revenue is recognized using the percentage-of-completion method, not when cash is received. Construction-specific documents like WIP schedules have no direct equivalent in most other industries.
How often should construction companies review their financial reports?
The full report suite should be reviewed monthly at minimum. Cash position and AR aging warrant weekly monitoring for firms with active projects. Firms using real-time dashboards can effectively track key metrics continuously rather than waiting for month-end closes.
What is the difference between overbilling and underbilling in a WIP report?
Overbilling appears as a current liability — the firm owes future work to the client. Underbilling appears as a current asset. Persistent underbilling signals cash flow stress even when the job looks profitable on paper.
What financial KPIs do lenders and bonding companies care most about?
Sureties and lenders focus on the current ratio, working capital level, debt-to-equity ratio, and the WIP schedule. They want evidence the firm isn't consistently overbilling or carrying deteriorating margins across its backlog.
What is the biggest financial reporting mistake construction companies make?
Acting on financial data too late. By the time a monthly WIP is assembled and reviewed, project conditions have already shifted — and the opportunity to correct margin fade before it becomes permanent has passed.
Why does the WIP report take so long to prepare in most firms?
WIP preparation requires reconciling data from multiple sources — field systems, ERP, payroll, subcontractor invoices — and manually calculating percentage of completion and cost-to-complete for each active job. In firms relying on spreadsheets, this typically consumes one to two weeks of staff time each month. Automated platforms that sync directly from ERP systems can compress that same process to minutes.