Introduction
Construction projects rarely fail because of a single catastrophic event. They erode incrementally — through scope gaps, unforeseen site conditions, material price swings, and design revisions that nobody budgeted for. McKinsey's analysis of 500+ global capital projects found average cost overruns of at least 79% relative to feasibility-stage budgets. That's not bad luck. It's the predictable result of treating contingency as an afterthought.
Budget contingency is the deliberate financial reserve built into a project budget to absorb cost surprises without derailing profitability. Done correctly, it's a calculated number — derived from phase-level risk analysis, not a round percentage applied to the total and forgotten.
This article walks through a 5-step calculation process, the variables that set the right contingency percentage, the most common calculation errors, and how to manage drawdowns actively from kickoff through closeout.
Key Takeaways
- Contingency is a pre-calculated reserve derived from identified risks — not a vague buffer or padding habit
- Percentages range from 3–5% for well-defined new construction to 25%+ for historic renovation or early-stage projects
- Percentage-of-base-cost works for most projects; Expected Monetary Value (EMV) is better suited to large or complex ones
- Owner and contractor contingency must always be tracked as separate line items with separate cost codes
- Unused contingency requires formal approval before use and should be released systematically as risks close out
How to Calculate Budget Contingency: A 5-Step Process
A single blanket percentage applied to total project cost will leave some areas over-reserved and others dangerously thin. Phase-by-phase calculation produces a more accurate, defensible number — one that holds up when presenting budgets to lenders, bonding companies, or executive stakeholders.
Step 1: Break the Project Into Phases and Identify Risks in Each
Start with the standard four-phase breakdown:
| Phase | Key Risk Drivers |
|---|---|
| Exploration / Feasibility | Program scope gaps, incomplete site data, regulatory unknowns |
| Design | Incomplete documents, coordination conflicts, scope creep |
| Procurement / Bidding | Subcontractor availability, escalating material prices, long-lead items |
| Construction / Execution | Subsurface conditions, weather delays, sequencing changes |
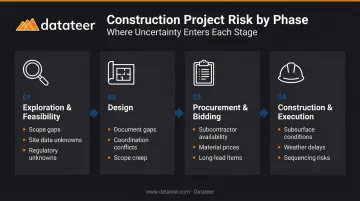
Renovation projects carry a fifth layer of risk on top of this: hidden conditions inside existing structures. Asbestos, outdated electrical, undocumented structural modifications — none of these appear in the drawings until demolition begins.
Step 2: Build Detailed Base Cost Estimates for Each Phase
Contingency is calculated as a percentage of base cost, so if the base cost is soft, the contingency is soft. Base costs should be assembled from digital quantity takeoffs tied to current labor, material, and equipment rate data — not ballpark figures pulled from a prior project.
Assign a Confidence Grade to each cost line item:
- High confidence — unit costs confirmed by recent bids or contracts
- Medium confidence — priced from published data (RSMeans, recent comps)
- Low confidence — conceptual estimate or early schematic pricing
Lower-confidence line items should carry proportionally higher contingency allocations. According to AIA, errors and omissions in construction documents typically account for less than 5% of total project costs when estimates are built carefully — but that number climbs fast when the underlying takeoff is imprecise.
Step 3: Assign Risk-Based Contingency Percentages by Phase
The core formula is straightforward:
Contingency Amount = Base Cost × Contingency Percentage
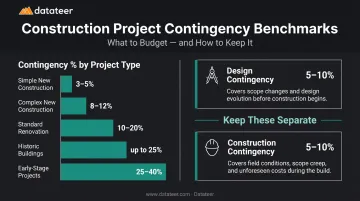
Industry benchmark ranges by project type:
- New construction (simple): 3–5%
- New construction (complex): 8–12%
- Standard renovation: 10–20%
- Historic or older buildings: up to 25%
- Early-stage projects (under 30% design completion): 25–40%
Two types of contingency should appear as separate line items in every budget:
- Design contingency — covers plan changes and coordination gaps; AIA recommends 5–10% of construction costs, included directly in the owner's project budget
- Construction contingency — covers on-site surprises like unforeseen soil conditions, typically another 5–10%
Never merge these. They serve different purposes and follow different approval chains.
Step 4: Sum Phase Contingencies and Add a Project-Wide Risk Buffer
Once per-phase contingencies are calculated, add them together to produce a total reserve amount. Then compute the overall contingency percentage:
(Total Contingency ÷ Total Base Cost) × 100
This number is what you report to stakeholders and lenders.
That phase-level total doesn't cover everything, though. A separate management contingency layer addresses risks that cut across all phases — supply chain volatility, regulatory changes, market escalation. McKinsey's research on megaprojects found that 98% suffered cost overruns exceeding 30%. The project-wide buffer isn't a precaution; it's what separates projects that finish on budget from those that don't.
Step 5: Integrate Contingency Into the Finalized Project Budget
Adding contingency to base cost is simple arithmetic:
$500,000 base cost + $40,000 contingency = $540,000 total project budget
What's not simple is the governance structure around it. Two rules matter here:
- **Owner contingency and contractor contingency must be separate line items** with separate cost codes — they serve different purposes and follow different approval processes
- Contingency must never be pooled with direct cost lines — it remains a dedicated, separately coded reserve to maintain financial transparency for audits, lender reporting, and stakeholder communication
Percentage vs. EMV: Which Calculation Method Fits Your Project?
The Percentage-of-Base-Cost Approach
This method works for most commercial, residential, and mid-size construction projects. It's fast, defensible when backed by phase-level risk analysis, and straightforward to present to stakeholders. CMAA notes that contingency has traditionally been calculated as a percentage of total project cost, typically ranging from 5–15% at the time of bidding — though phase-level analysis should refine that further.
When projects grow in complexity or contract value, a percentage alone stops being enough. That's where EMV comes in.
The Expected Monetary Value (EMV) Method
For larger or higher-complexity projects, EMV provides a more structured alternative.
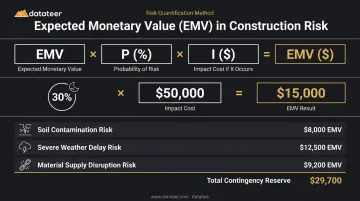
The formula:
EMV = Probability of Risk Occurring (%) × Impact Cost ($)
Example: A 30% probability of contaminated soil requiring $50,000 remediation yields an EMV of $15,000 for that risk item. EMV is additive — you calculate it for each identified risk and sum the results to determine your total contingency.
EMV is the right tool when:
- Multiple high-consequence risks can each be individually scoped and priced
- Public infrastructure or GMP contracts require formal risk documentation
- The owner needs quantified risk data in financial reporting
- Project complexity justifies the added analytical work
Key Variables That Determine the Right Contingency Percentage
Contingency is a function of several variables: some controllable, others market-driven. Finance Managers who understand each one can set contingency with precision rather than defaulting to round numbers.
Design Completion Level
The most reliable predictor of contingency need is how fully defined the project scope is at the time of budgeting. The AACE Class 1–5 estimate framework maps this directly:
| AACE Class | Design Maturity | High-Side Accuracy Range |
|---|---|---|
| Class 5 | 0–2% complete | +30% to +50% |
| Class 4 | 1–15% complete | +20% to +30% |
| Class 3 | 10–40% complete | +10% to +20% |
| Class 2 | 30–75% complete | +5% to +15% |
| Class 1 | 65–100% complete | +3% to +10% |
The practical takeaway: formally reduce contingency at each major design milestone as scope uncertainty is resolved. A Class 5 estimate warrants substantially higher reserves than a Class 1 — the table shows exactly how much.
Project Type and Complexity
Risk exposure varies widely across project categories:
- Simple new construction — predictable site conditions, standardized systems: 3–10%
- Complex new construction — multiple systems, tight urban sites: 8–15%
- Standard renovation — existing conditions visible and documented: 10–20%
- Historic renovation — unknown structural conditions, potential hazardous materials, code compliance gaps: up to 25%
Site and Subsurface Conditions
Geotechnical unknowns — unstable soil, underground utilities, contamination, high water tables — are among the most common triggers for contingency drawdowns. ASCE research confirms that differing site conditions are frequently unexpected at bidding and carry high schedule impact alongside cost exposure. Until geotechnical investigations are complete, carry higher allocations to account for what the ground may reveal.
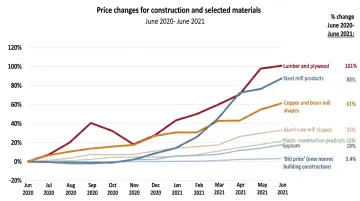
Market and Supply Chain Conditions
Material price volatility directly affects contingency adequacy. During the 2020–2021 cycle, AGC documented input cost increases of 111% for lumber and plywood, 76% for steel mill products, and 60% for copper and brass mill shapes within a single 12-month period. More recently, RLB reported a 4.69% year-over-year national average increase in construction costs through Q4 2024. Contingency percentages set during stable markets may be insufficient during periods of active escalation.
Regulatory and Permitting Exposure
Projects requiring federal environmental review carry material schedule and cost uncertainty. CEQ data shows that for Environmental Impact Statements issued from 2019–2024, the median time from Notice of Intent to final EIS was 2.8 years. Any project with environmental review requirements should quantify that exposure separately and carry a higher contingency buffer to match.
Common Mistakes in Construction Contingency Budgeting
Applying a Blanket Percentage Without Phase-Level Analysis
Attaching a single 10% to total project cost produces a number that's simultaneously too conservative for low-risk phases and dangerously thin for high-risk ones. The result is poor risk visibility across the entire project. You can't tell where you're exposed until it's too late.
Treating Contingency as a Substitute for Scope Definition
Contingency absorbs "known unknowns": risks that can be anticipated but not precisely quantified. It does not fix an incomplete scope definition, unresolved design conflicts, or foreseeable costs that were simply excluded from the estimate. If you're inflating contingency to compensate for an underdeveloped scope, address the scope problem directly.
Failing to Separate Owner and Contractor Contingency
These serve fundamentally different functions:
- Owner contingency — covers owner-directed scope changes not included in the original contract
- Contractor contingency — covers on-site execution risks and cost uncertainties within the contractor's scope
Commingling them obscures accountability and creates disputes over who controls the funds. Keep them in separate cost codes from day one.
Not Reassessing Contingency as the Project Progresses
Contingency set at kickoff becomes misaligned with actual risk exposure if it isn't re-evaluated at key milestones. Track your contingency drawdown rate: the pace at which the reserve is being consumed relative to project progress.
Both extremes are worth flagging:
- A drawdown rate running ahead of schedule completion is a direct warning signal
- An unexpectedly slow rate often means risks haven't been documented or submitted through the proper change process, not that the project is running smoothly
How to Monitor and Manage Contingency Drawdowns
Setting the contingency number is half the job. Controlling how it's spent is the other half.
Governance Basics
Every contingency withdrawal should require:
- Written justification tied to a specific risk event
- Formal approval from the designated authority (owner, PM, or CFO depending on amount)
- Linkage to a specific change order or documented PCO
A Proposed Change Order (PCO) log serves as the gatekeeping mechanism. No drawdown should occur without a corresponding PCO entry.
The Real Problem With Spreadsheet-Based Tracking
Manual spreadsheet workflows create a dangerous lag between when contingency is drawn and when the finance team sees it. By the time the month-end WIP report is compiled, a project can be weeks into consuming contingency faster than planned — with no one having noticed.
Datateer's construction financial dashboards sync directly from ERPs — including Sage, Viewpoint Vista, Procore, Acumatica, CMiC, and Foundation Software — giving CFOs and Finance Managers continuous visibility into cost variance at the job, phase, and cost-code level. The Cost Variance and Job Costing & Cost-to-Complete modules flag whether jobs are converging or diverging from target without waiting for month-end close.
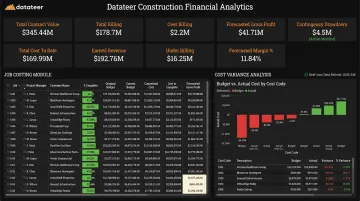
One Datateer client put it plainly: "The very first time we accessed our data through a Datateer analytics dashboard, that one click replaced two weeks worth of prior work."
Firms that catch contingency drift early do so because they're reviewing it continuously — not reconstructing it after the fact.
Frequently Asked Questions
What is a contingency budget for construction?
A construction contingency budget is a reserved portion of the total project budget set aside to cover unforeseen costs — site conditions, design changes, or material price increases — that can't be anticipated at the time of budgeting. It's not tied to any specific scope item; it acts as a financial buffer against both identified and unidentified risks.
Should contingency costs be included in a project budget?
Yes, and always as an explicit line item. Excluding contingency doesn't eliminate risk — it eliminates the financial mechanism for handling it. Teams without a formal reserve end up pulling funds from active cost lines, compromising quality, or seeking emergency financing when surprises hit.
How do you set contingencies within a budget?
Break the project into phases, assign a risk level to each, and multiply each phase's base cost by the appropriate risk-based percentage. Sum the phase contingencies and add a project-wide management buffer. The right percentage depends on scope definition completeness, project type, and site conditions.
What is the difference between owner contingency and contractor contingency?
Owner contingency is controlled by the project owner and covers scope additions or owner-directed changes not in the original contract. Contractor contingency is built into the contractor's price to cover execution risks and field surprises within their scope. The two must always be tracked separately.
What happens to unused contingency at project closeout?
It depends on contract structure. Owner contingency typically reverts to the owner; contractor contingency may become additional profit. GMP contracts often include shared-savings splits — Ellis & Winters notes that 60/40 or 75/25 owner-contractor splits are common, though owners frequently negotiate to retain unused funds entirely.
How does design completion level affect contingency percentage?
Contingency percentage is inversely related to design completeness. Early-stage projects under 30% design completion may require 25–40% contingency because significant cost uncertainty remains. Fully developed projects with 90%+ complete construction documents typically need only 3–10%. Contingency should be formally reduced at each major design milestone as uncertainty resolves.